Web Text Analysis Based on Social Media
Web Text Analysis Based on Social Media: Visitor Studies of UCCA Center for Contemporary Art
Xingyi Chen
Table of Contents
Abstract: Since the outbreak of COVID-19, museums have been closed frequently, encountering problems such as loss of audience and financial crisis. In the turbulent post-pandemic era, how to deal with changes and what aspects need to be improved have become the main problems they face. This paper takes UCCA Center for Contemporary Art, Beijing, China, as an example, using web text analysis from comments of audiences on Dianping.com, combined with UCCA’s goal to analyze its micro-strategy, transformation of strategies, and the effects of transformation. Moreover, this paper reveals the changes in visitors’ focus and remaining problems of UCCA before and after COVID-19. The results show that UCCA used a more economical membership mechanism to establish close relationships with audiences, which made the complaints of high-price tickets less. Before the pandemic, the audience focused on the content of exhibitions, however, after that, the demands of audiences became more abstract and they tend to talk about their feelings and emotions generated from exhibitions. Meanwhile, UCCA switched its exhibition themes to be more related to the times and people to communicate with the audience more deeply. In a post-pandemic era, on-site studies sometimes are restricted in China, while studying museum visitors based on acquiring data from social media is relatively steady. Meanwhile, the paper provides a method for art managers to replicate the study that can be used for analyzing their institutions.
Keywords: museum experience; visitor studies; art institutions; web text analysis; COVID-19
INTRODUCTION
Visitor studies have played a part in the sustainable development of museums since the twentieth century. Scholars investigated museum experience based on social, personal, and physical context , visitors’ learning (Hein, 1998), attention (Bitgood, 2013), and expectation (Sheng & Chen, 2012) using qualitative , such as narrative research (Everett & Barrett, 2009), case studies, participatory observation, and interviews (Feng & Lin, 2021), or quantitative methods, including structural equation mode (Dirsehan, 2011), regression approach (Brida et al., 2016), or hybrid methodologies (Chandra, Cambria, and Nanetti, 2020; Yi et al., 2022). Museums are different from other institutions since they have a consensus to serve as not-for-profit institutions that research, collect, conserve, interpret, and exhibit tangible and intangible heritage①. However, some researchers neglect this particularity or only focus on visitors, not interweaving their feedback with institutions’ strategies. In addition, humanities scholars rely on “close reading”②. to gain information traditionally, which is meticulous but leads to a lack of objectivity in results. Visitors’ demands are different and diverse (Falk, 2016), and research results vary by the sources and quantities of data, methodology, research context, and research perspectives. Authentic and scalable results need enormous data to verify.
In recent years, with the new push of big data, researchers started to use social media to obtain information and conduct research combined with text analysis. Text Analysis or text mining are machine learning techniques that use natural language processing (NLP) to transform unstructured data into structured data (Hotho et al., n.d.) for extracting specific words and phrases, trends, patterns, themes, and other implicit features from large information repositories (Han, Kamber, and Pei, 2011). While people in different countries have different applications preference. Western scholars tend to use Instagram (Chang et al., 2022) and Twitter (Kydros et al., 2021) for finding behavior patterns (Lee, 2021) and opinions (Chandra, Cambria, and Nanetti, 2020) of the public. Researchers from China are inclined to choose WeChat (Gu & He, 2021), Dianping.com (He et al., 2017), Ctrip (Jiang & Fu, 2020), and Mafengwo ( to analyze the attraction of tourism, education feedback, or to use text analysis based on collected interviews content (Jordi et al., 2014). Meanwhile, the audience is affected by outside variables, such as social environment and disasters, therefore, it is necessary to consider the changes in context inside the comments (Emily & Eric, 2011).
UCCA Center for Contemporary Art founded by collectors Guy and Myriam Ullens is committed to the belief that art can deepen lives and transcend boundaries. More than one million visitors come to visit each year. According to the “Art’s Most Popular 2019”, UCCA is the only private art museum in China on the lists. This paper takes UCCA Center for Contemporary Art as an example, using web text analysis from audience comments on Dianping.com, combined with UCCA’s goal to analyze its micro-strategy, transformation of strategies, and the effects of transformation. Moreover, this paper reveals the changes in visitors’ focus and remaining problems of UCCA before and after COVID-19. Studying museum visitors based on acquiring data from social media is valuable and necessary since this method is efficient for obtaining data with the help of digital tools, and not affected by physical restrictions, namely the pandemic. The paper also provides a method for art managers to replicate the study that can be used for analyzing their institutions.
The paper is structured as follows. Section 2 presents the methodology applied. Section 3 and 4 are results of the analysis and discussion. Section 5 discusses the limitations of this study and future research improvements.
METHODOLOGY
Text Analysis Method
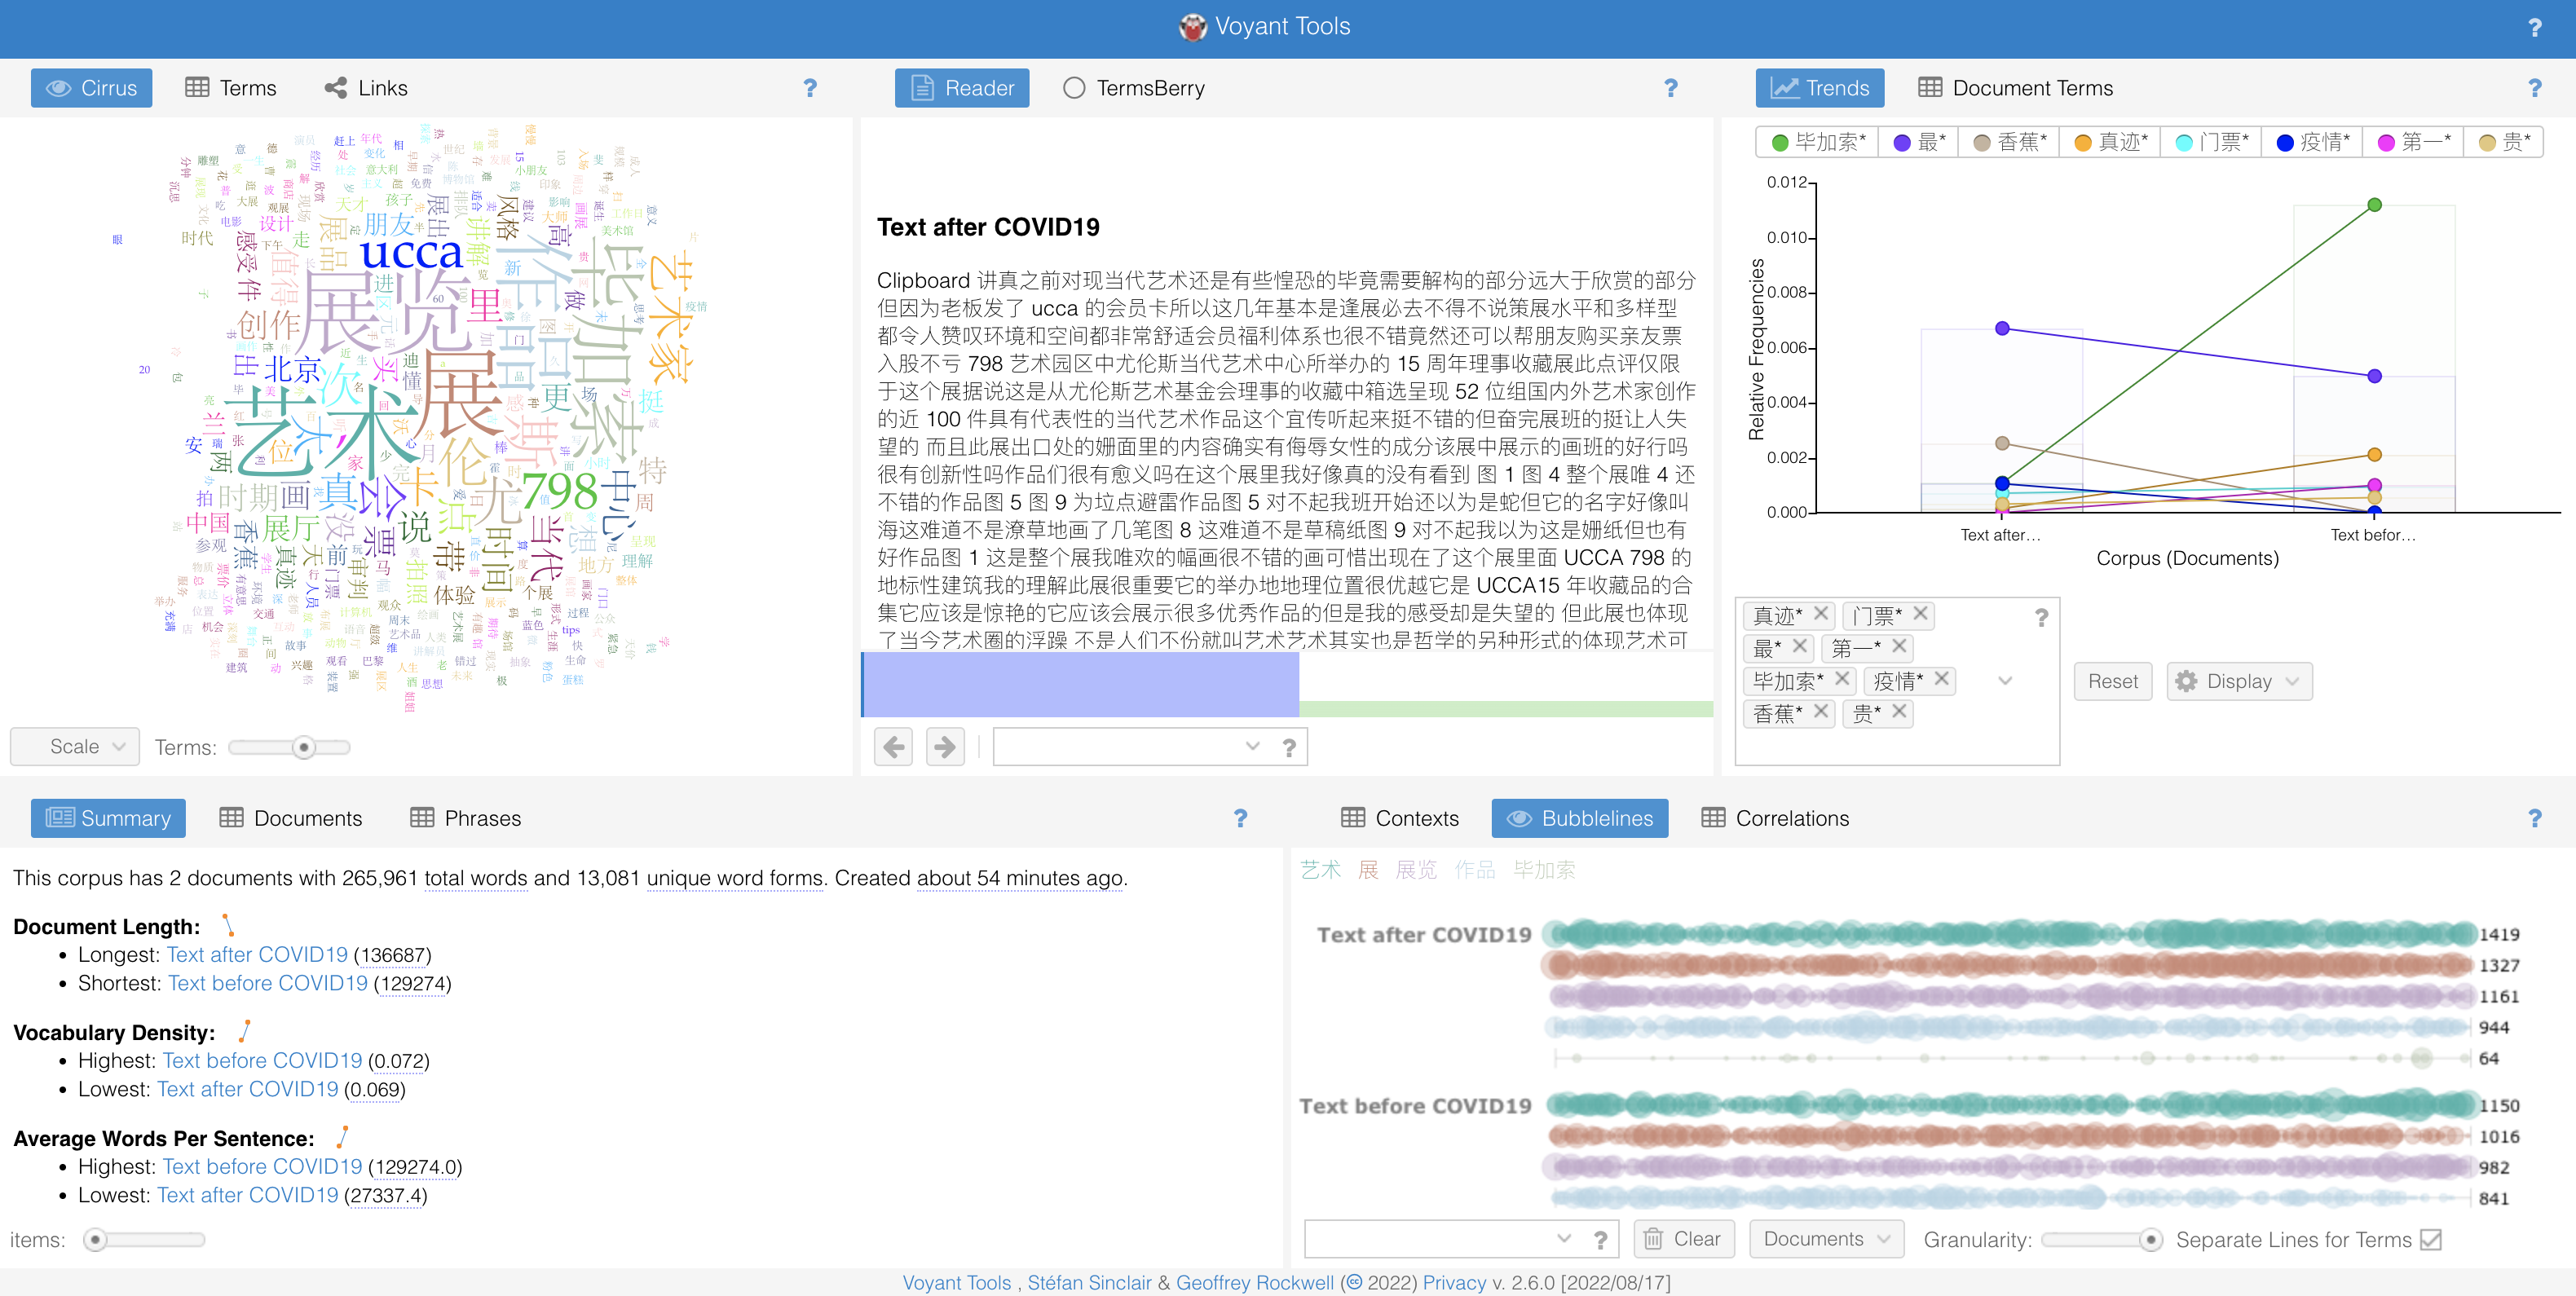
Figure 1. The interface after uploading the comments corpus on Voyant.
Voyant is a user-friendly and versatile web-based application for performing text analysis, which is valuable for interpretative research to extract informative evidence through high-frequency terms, relative trends, and frequencies (Miller, 2018). It is employed for quantitative analysis of qualitative marketing data (Hetenyi et al., 2019), extracting useful information, obtaining new insight from patient experience comments (Maramba et al., 2015), and conducting literature analysis (Hodhod & Fleenor, 2018). Nonetheless, Voyant has some drawbacks. It can be affected by network conditions, causing that many functions are missing or cannot be customized. However, it makes research feasible with the minimal time consumed and does not require users to have coding expertise, making it still a good supplementary tool for the average humanities scholar (Welsh, 2014).
Voyant has twenty-four tools to visualize the features of each document, or differences and relationships among several documents (Miller, 2018). Five tools were presented in Figure 3 (Cirrus, Summary, Trends, Reader, and Bubblelines) after uploading the comments corpus consisting of two documents. For trends analysis, all documents were analyzed as a whole and in two periods separately. This paper attempts to demonstrate the results by using the seven methods below, which are interconnected for verifying the results of each other:
- Document Terms (a table view of term frequencies for each document)
- Summary (an overview of the current corpus)
- Trends (a visualization of the frequencies of terms across documents in a corpus)
- Mandala (a visualization of the relationships between terms and documents)
- Bubblelines (terms frequency and distribution in a document)
- MicroSearch (frequency and distribution of terms in a document)
- The Contexts/ Keywords in Context (surrounding text of keywords)
Data Acquisition
The author collected data manually from Dianping.com, a public reviews net that hosts consumer reviews of restaurants, shops, and various institutions, which is similar to Yelp and TripAdvisor. Considering the research scope is comments analysis, this study excludes users’ privacy and personal information, such as names and ages. In total, 3178 comments on Dianping.com were acquired. After deleting invalid comments unrelated to UCCA, 3154 valid comments were recorded. The time scale of this study is from January 13th, 2010, when the first comment of UCCA was published on Dianping.com, to August 4th, 2022 when this study started to collect data. Although the official COVID-19 outbreak time is December 1st, 2019 when the first patient infected was discovered in China. On January 30th, 2020, UCCA published news about closing door because of COVID-19, so the time division should be January 30th, 2020 since after that day, the comments of UCCA are related to the pandemic. Therefore, this corpus was also divided into two Microsoft Excel documents. The numbers of comments are 1563 and 1591 respectively, before and after COVID-19.
Data cleaning
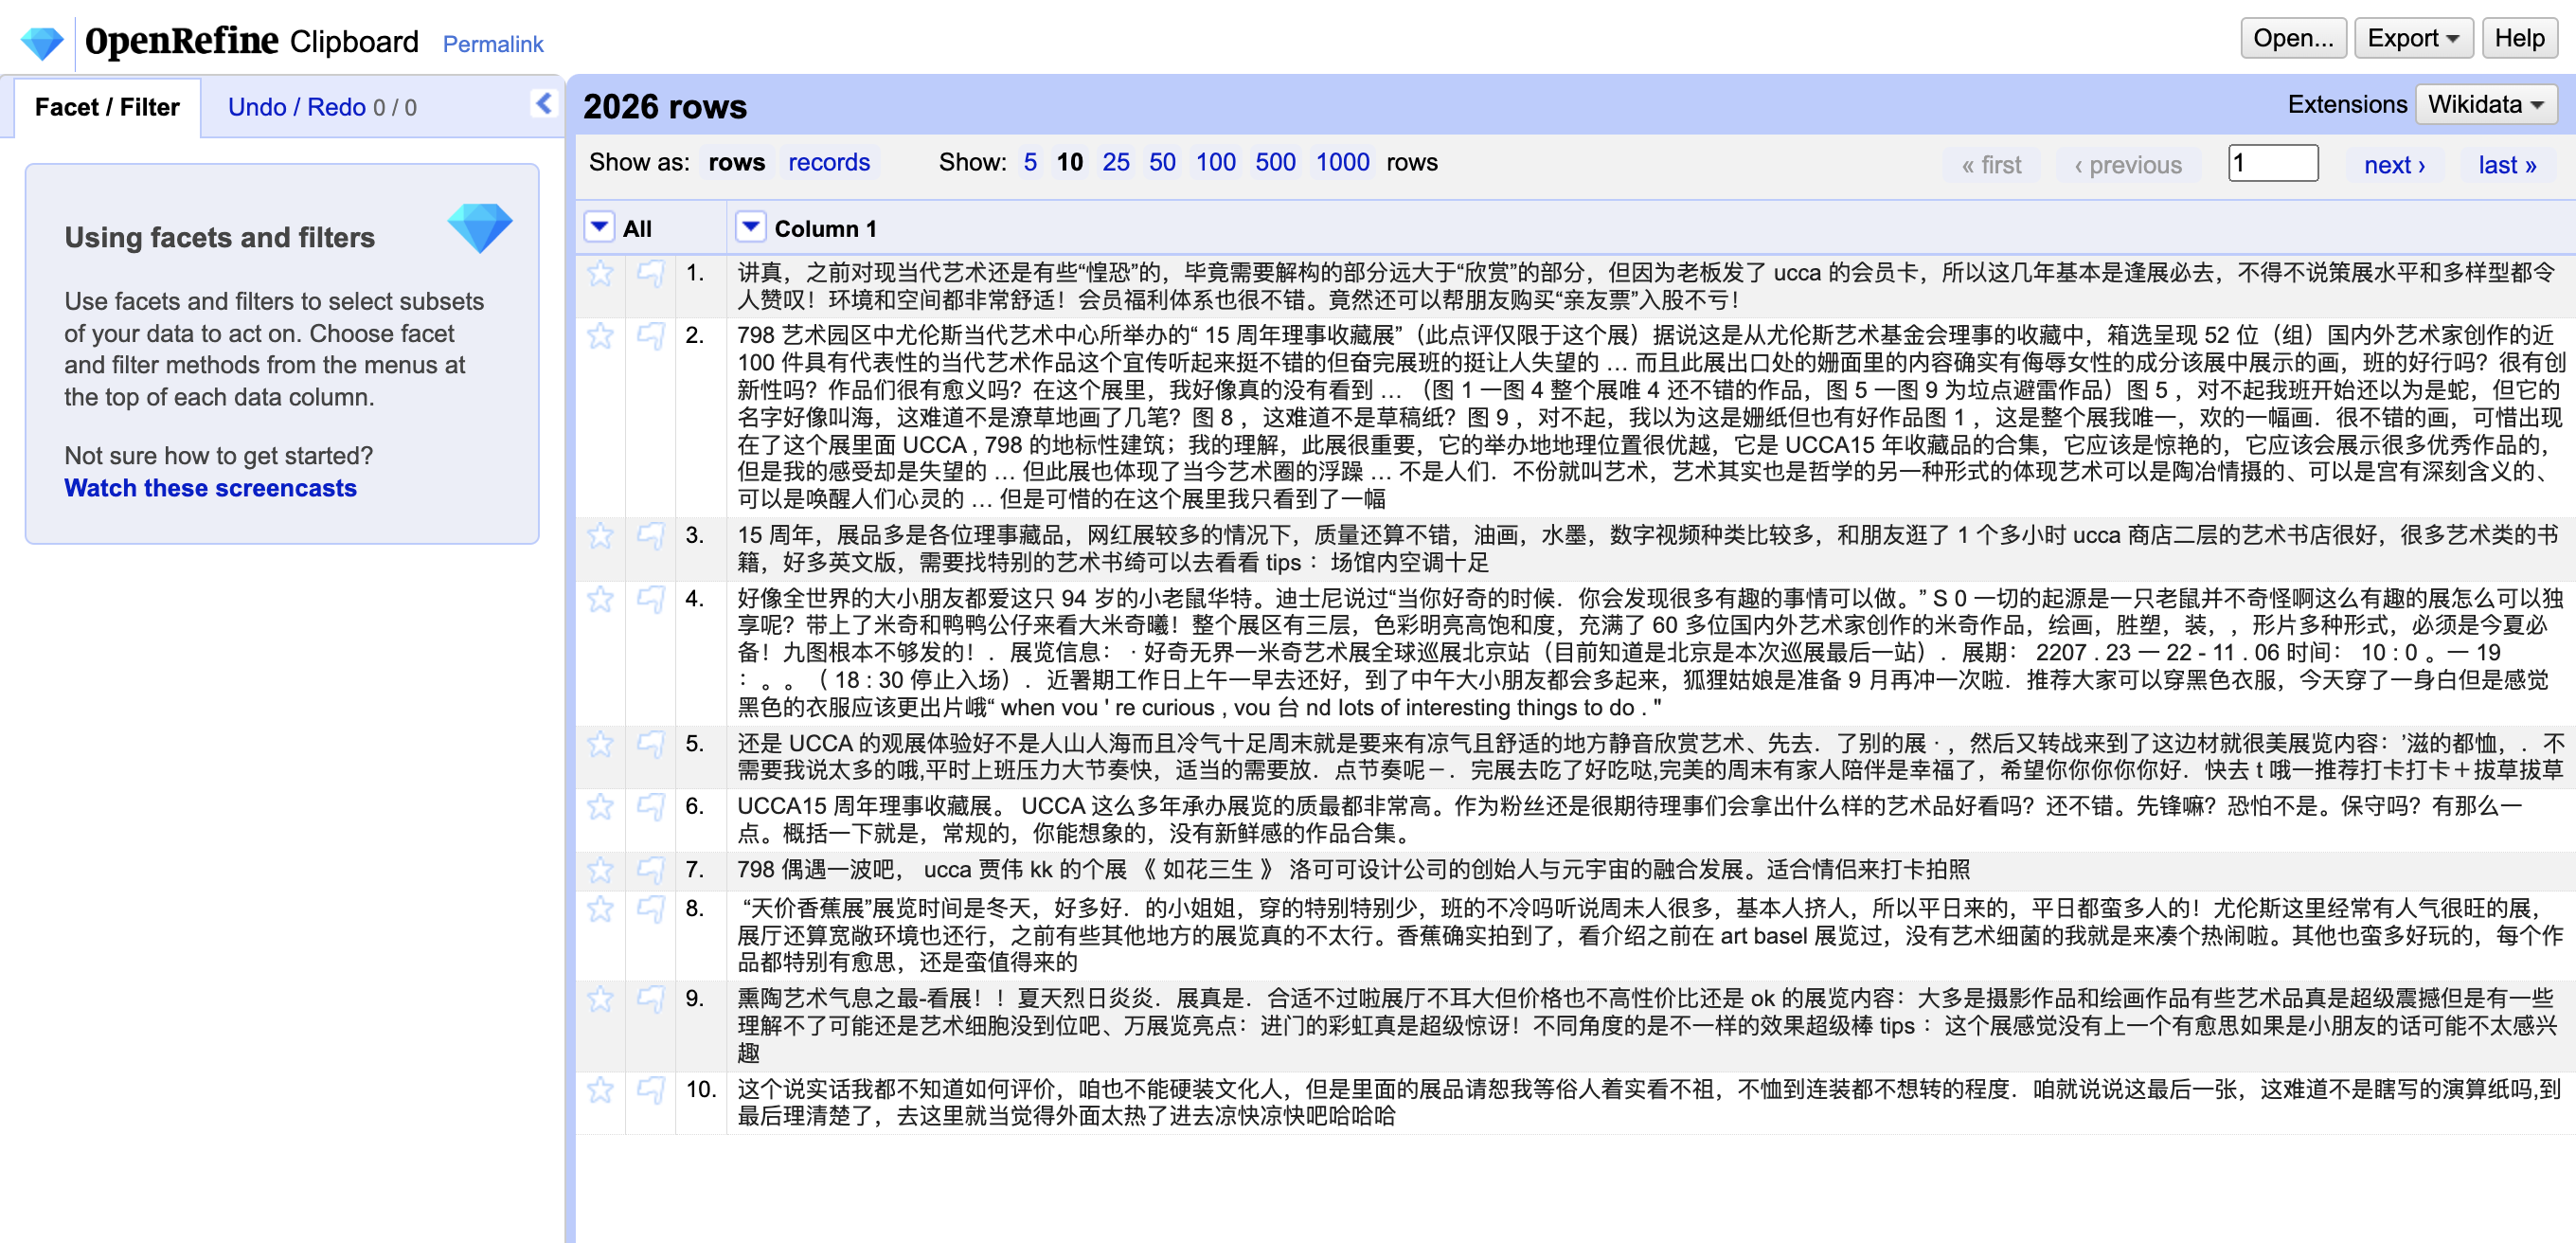
Figure 2. The corpus before cleaning in OpenRefine.
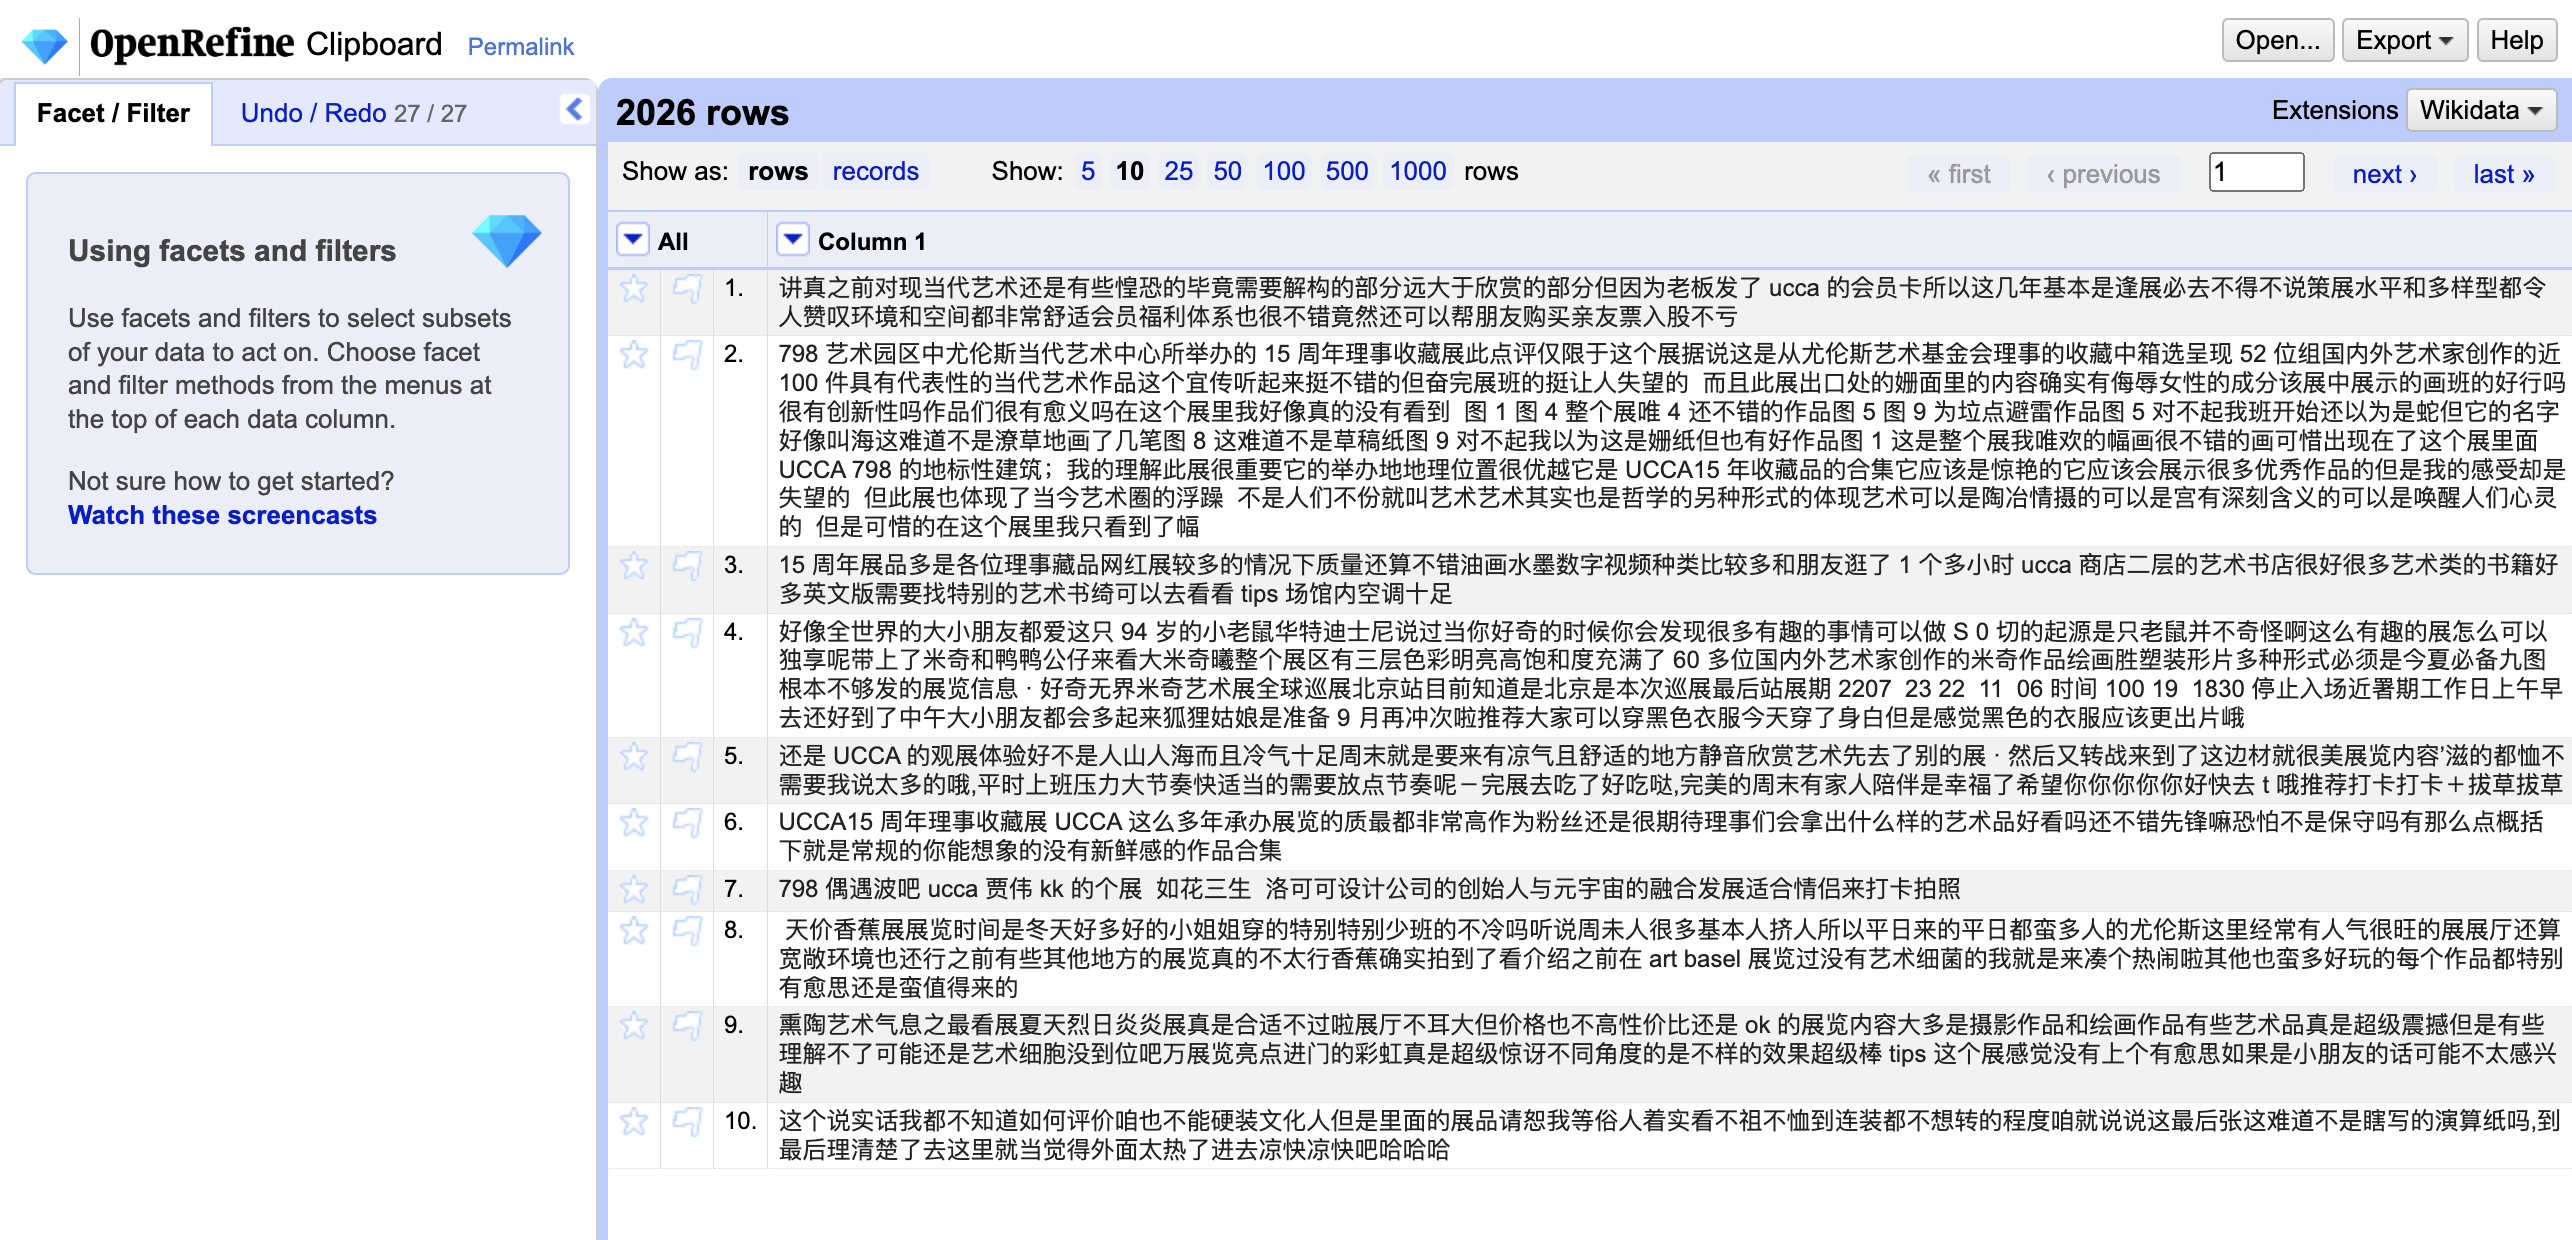
Figure 3. The corpus after cleaning in OpenRefine.
At this stage, cleaning data is needed. In Chinese, some punctuations are different from English. Such as the comma is “,”, and the full stop is “。”. Some punctuations are unique, for instance, “《》”, “、”, “——”, and “[]”, etc. (Figure 1). Besides, Chinese visitors combined multiple symbols to convey special feelings, such as “~”, “*”, “!?!?”, “????”, and emojis. Some Text Analysis tools designed for analyzing English corpus cannot identify these non-English symbols. Therefore, to ensure the accuracy of the analysis results, this paper uses OpenRefine, an open-source desktop application for data cleanup, to remove useless punctuations and symbols (Figure 2). After cleaning, the total words of the comment corpus are 265,961 compared with 306,181 words before.
RESULTS
High-frequency terms
Table 4
High-frequency terms after summarizing
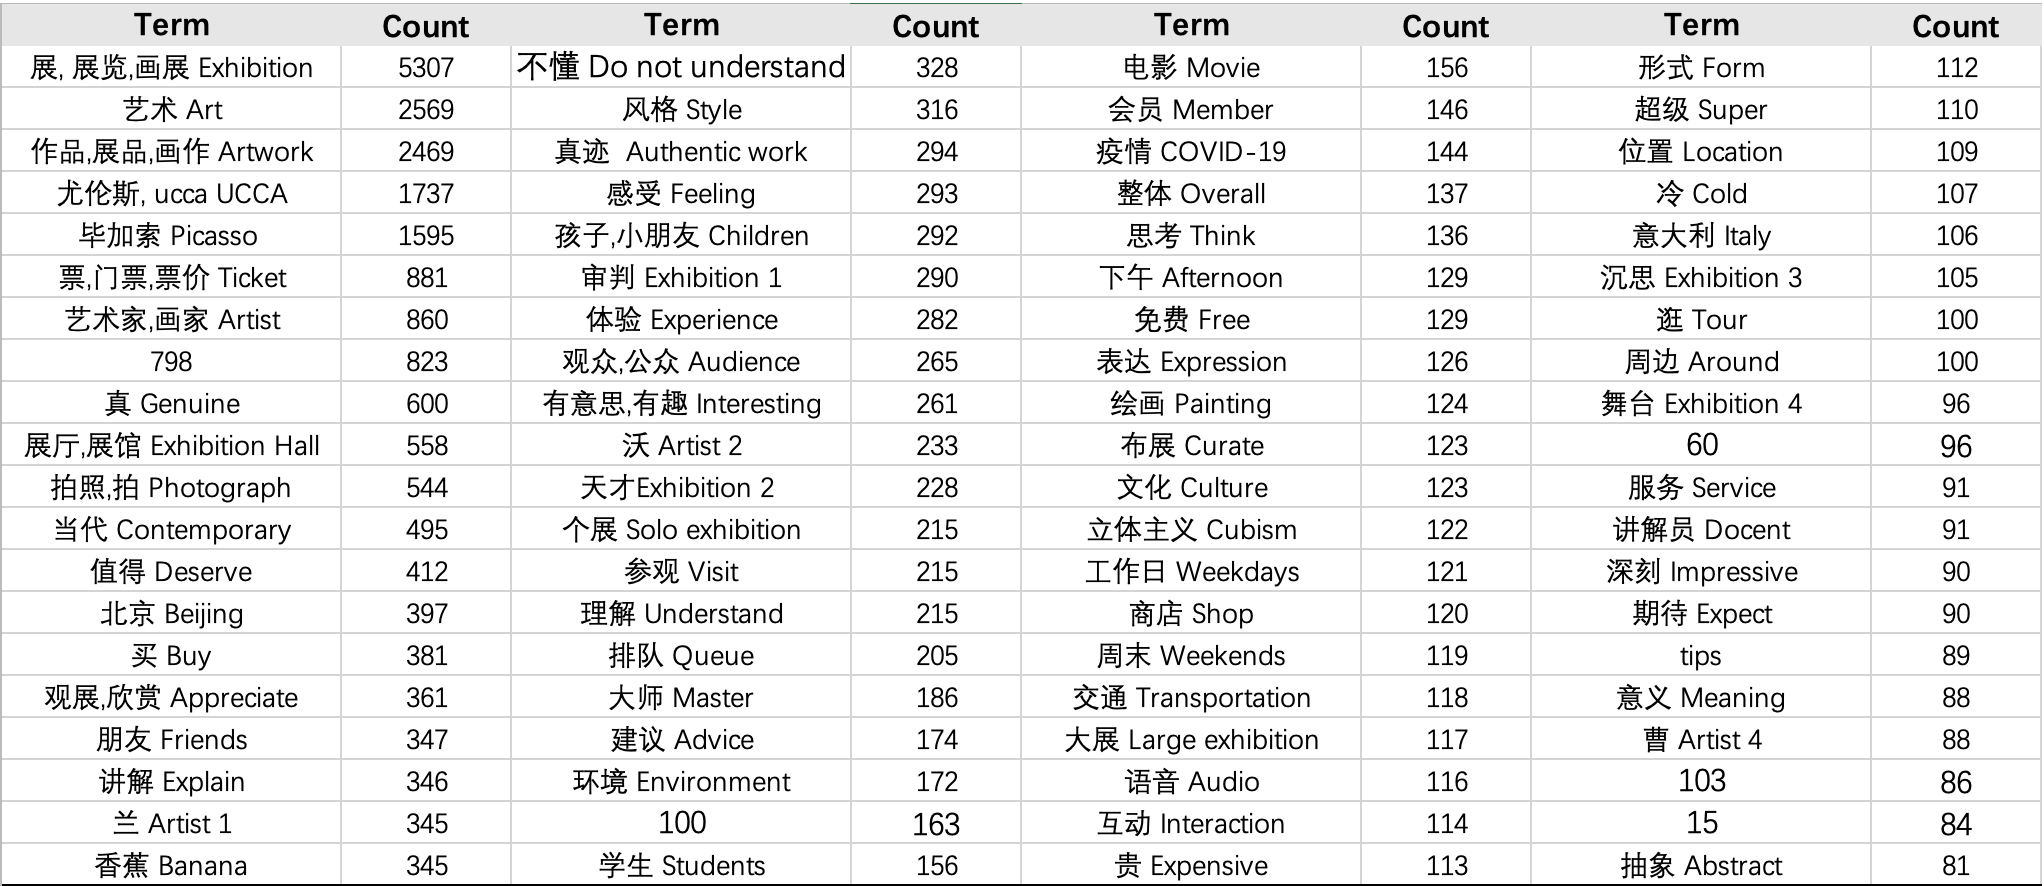
In the Chinese language, there are different expressions to express the same meaning. For example, “展览”, “展”, and “画展” all mean “Exhibition” in the English language. After obtaining the top 100 words from the Document Terms tool, the author summarized them into 80 words. Figure 4 reveals the high-frequency terms overall corpus. “Exhibition” was mentioned the most, followed by “Art”, “Artwork”, and “Artist”. The audience cared more about the whole situation than the details. Among these terms, some refer to exhibition names and artist names③. Compared with other exhibitions in UCCA, “Picasso: Birth of a genius” was discussed the most, which means this exhibition is the most prominent one among all exhibitions, and it may also have had a pivotal influence on the popularity of UCCA in the 798 Art District and China.
Purposes and complaints
Table 5
Terms about purposes and complaints of the audience, extracted from Table 4
Some terms have reflected visitors’ purposes for going to UCCA and the points of attention for them in exhibitions, namely taking photos (photograph), buying art derivatives (buy), appreciating artworks (appreciation), learning from explanation (explain), and experiencing the “aura” in artworks and exhibitions (feeling and experience), etc. While some are complaints, such as some content cannot be understood (not understand), waste of time for queuing (queue), ticket prices or art derivatives were too expensive (expensive), and too cold because of the air conditioner (cold), and so on. From the relative top terms, it is clear to know what visitors’ real concerns are and what aspects need to improve for UCCA.
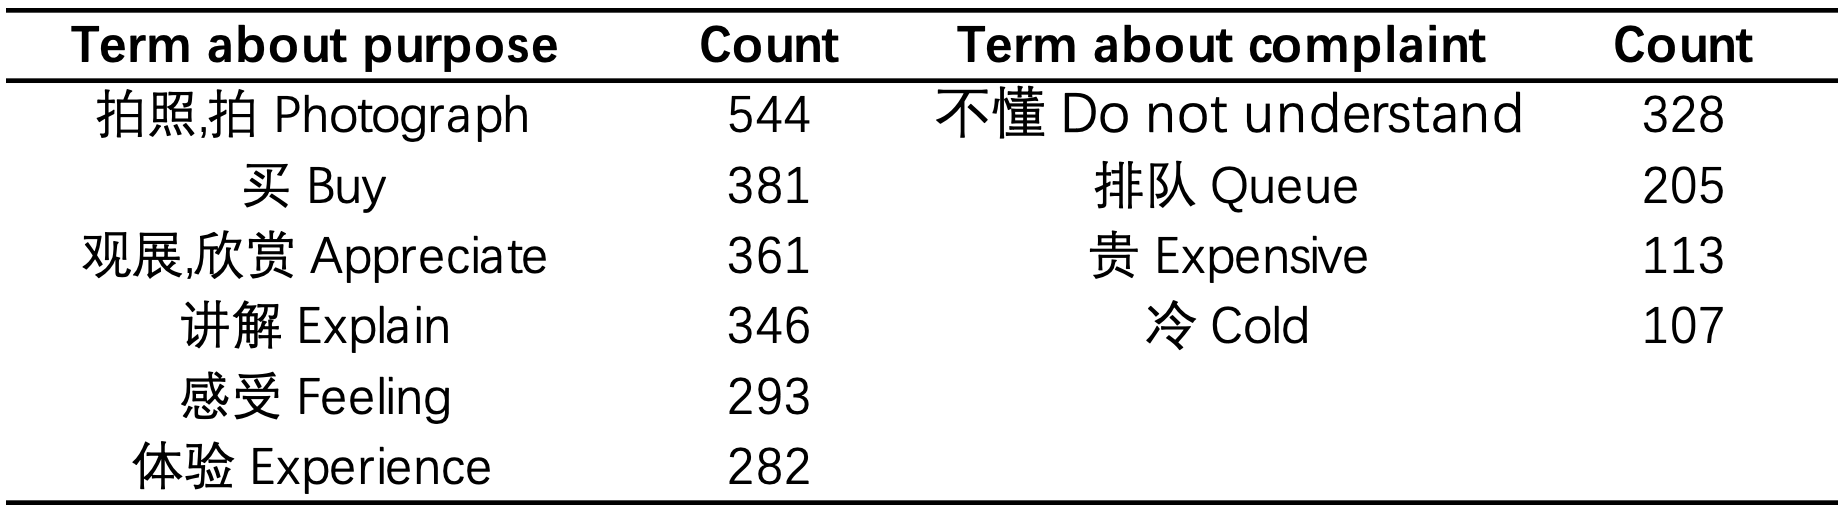
Trends of ticket price
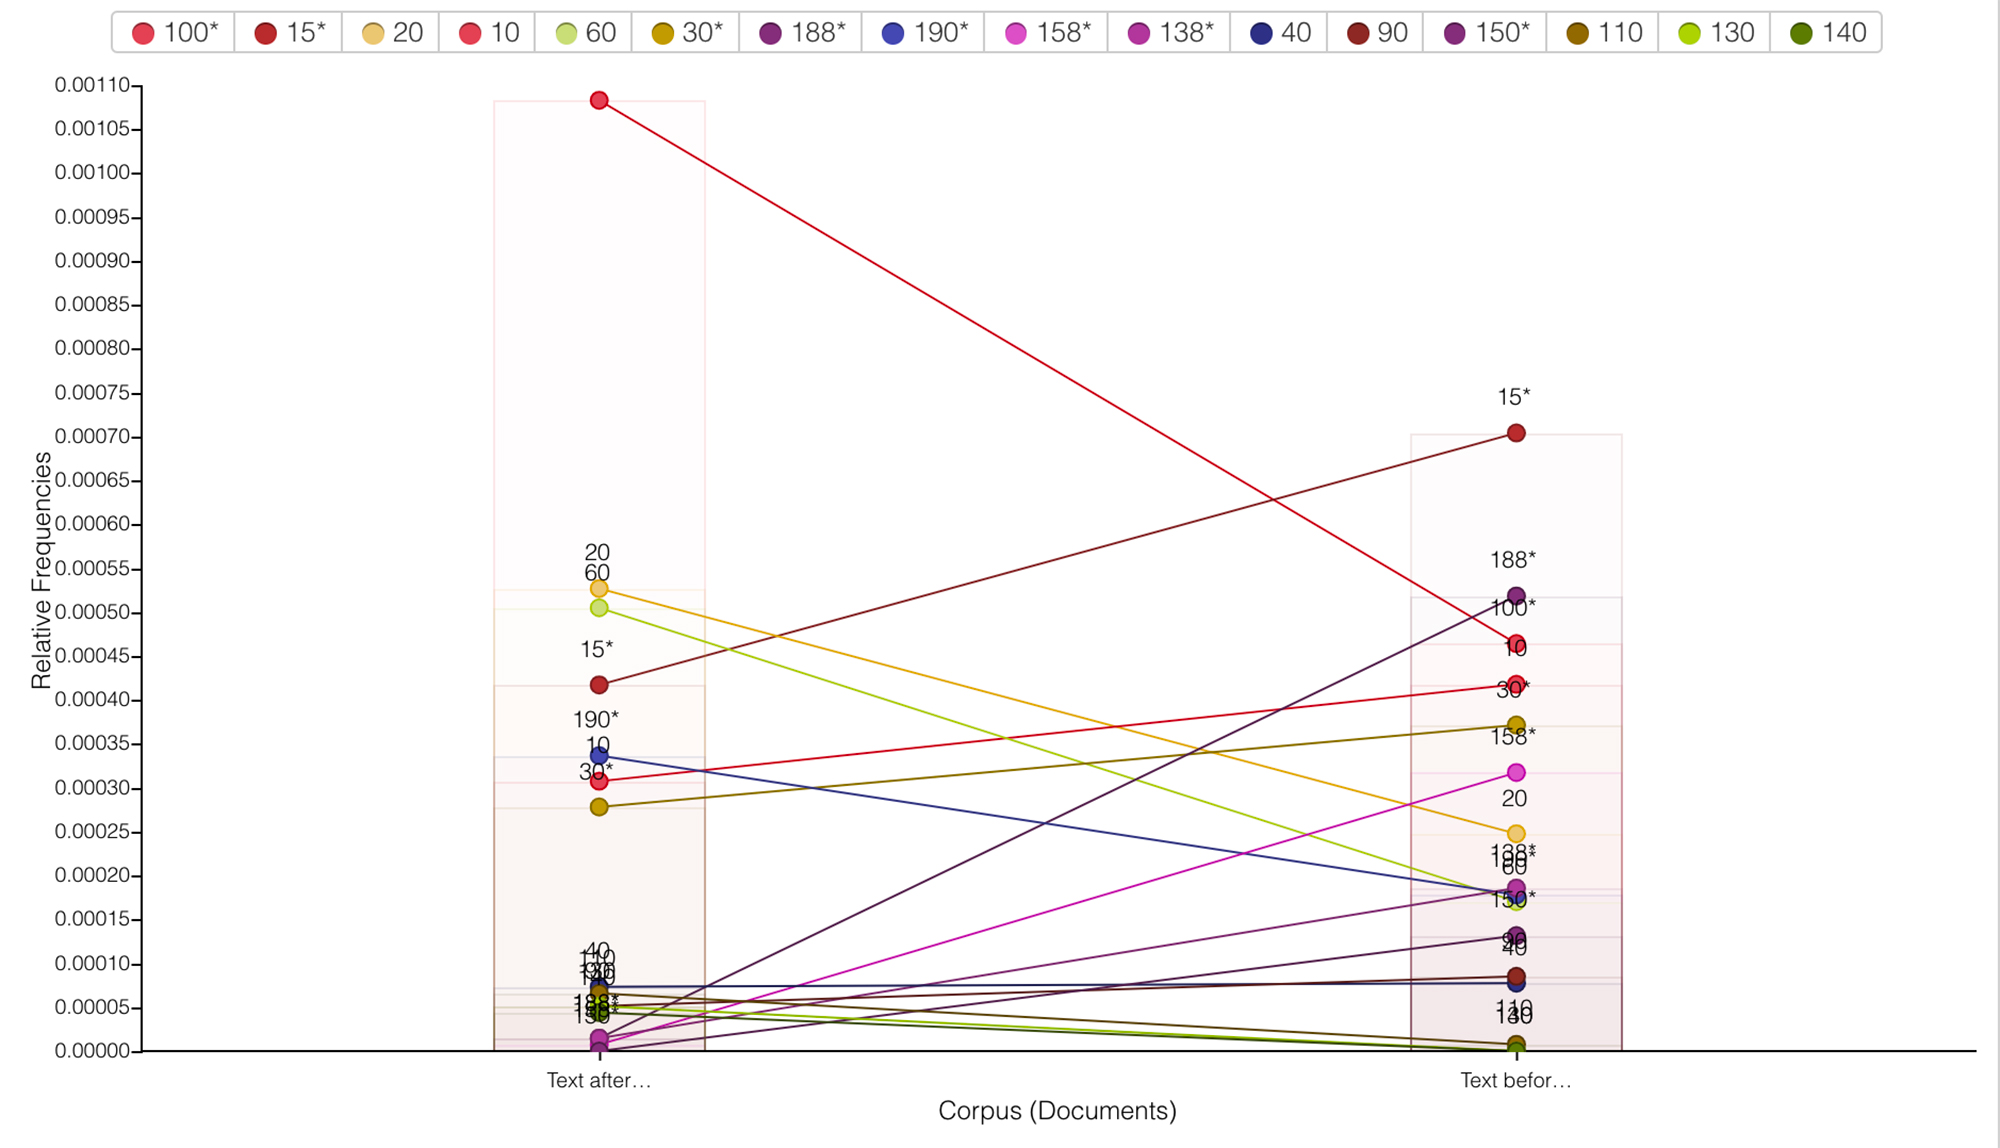
Figure 6. Relative frequencies of numbers.
Except for the attraction of art, visitors talked about “Ticket” 881 times (Figure 4), including a number of comments complaining about the high prices of tickets. In Figure 4, the numbers collected, namely 100, 60, 103, and 15 may refer to ticket prices. Thus, the prices need to be extracted and verified in another way. The author used the Context Tool to search “元” (Chinese Monetary Unit), “票” (Ticket), and “票价” (Ticket Price), then collected the numbers around these three words. Prices are mentioned by visitors in the comment corpus from the lowest at 10 RMB to the highest at 190 RMB (Figure 6). Most high prices set before were cut down now, and 100 RMB became the main price, while 15 RMB was the majority price before. Among these numbers, some refer to the same exhibition. For example, one exhibition has three different prices for students, children, and the elderly.
Relative frequency of selected terms
Figure 7. The relationships between terms and documents.
Figure 7 presents the relationships between selected terms and the documents. Each search term pulls documents toward it based on the term's relative frequency in the document. From the relative distance, it is obvious to see the changes of focus of visitors. Photographs and interpretation are concerned during both periods, and photography is also one of the features of UCCA. The exquisite design and decoration of exhibitions have attracted plenty of visitors, especially the young. Before COVID-19, the audience cared more about the content of exhibitions as well as the physical environment (Exhibition Hall). While nowadays, they tend to focus on their feelings, emotions, and the atmosphere in exhibitions, which means that the demands of visitors are getting more abstract.
In addition, UCCA had a strong connection with the 798 Art District. Among these comments, another significant difference is the relative frequency of "798" and “UCCA”. In the past, and visitors mentioned "798" more than "UCCA". Because some visitors came to the 798 Art District to travel and then visited UCCA passing by. Or some went to visit UCCA because there were also many other entertainments, such as coffee shops, book stores, and restaurants nearby as a combination of tourist destinations. However, with time passing by, people tend to mention UCCA more than 798 Art District, which reveals that the audience focused on the UCCA itself more. Nowadays, as a symbol of the 798 Art District, its uniqueness becomes more and more acceptable. Therefore, it is necessary for art institutions to take into account the geographic benefits. Meanwhile, fast self-development is also a priority.
Due to dividing the complete and coherent corpus with contextualized meaning into numerous smaller words and phrase units (Krippendorff, 2018), there was an issue with Voyant in the process of analyzing the Chinese corpus. For example, in the Chinese language, except for using “no” and “not” directly to convey negation, there is plenty of different expressions used in the context that can have the same meaning, which cannot be recognized by Voyant and other analysis tools. It cost more time and consideration for a non-English Digital Humanities research project than for an English project.
DISCUSSION
Keep up with the tide and act fast
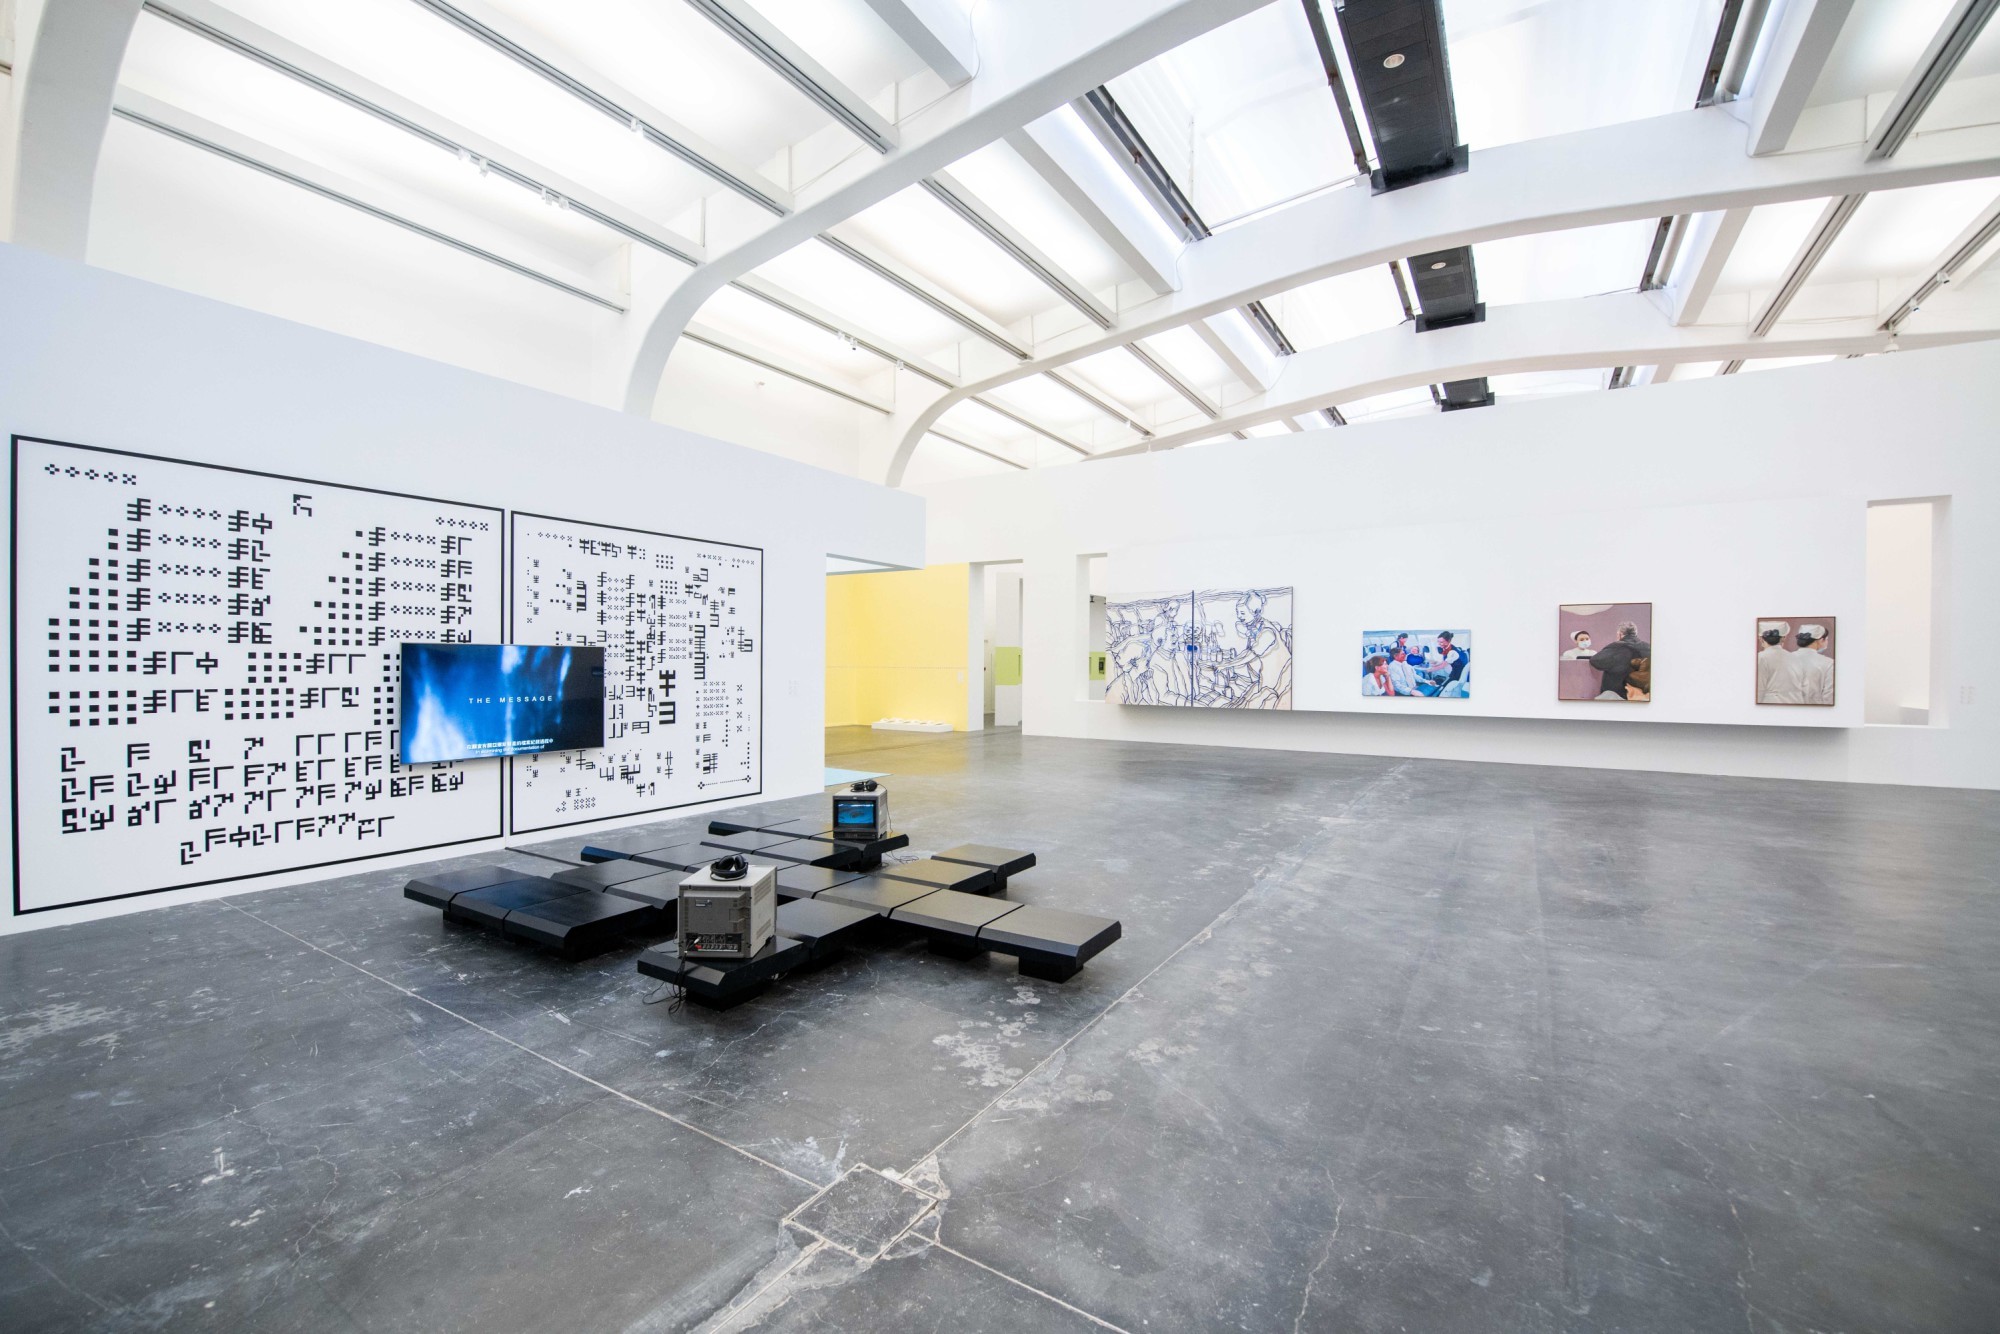
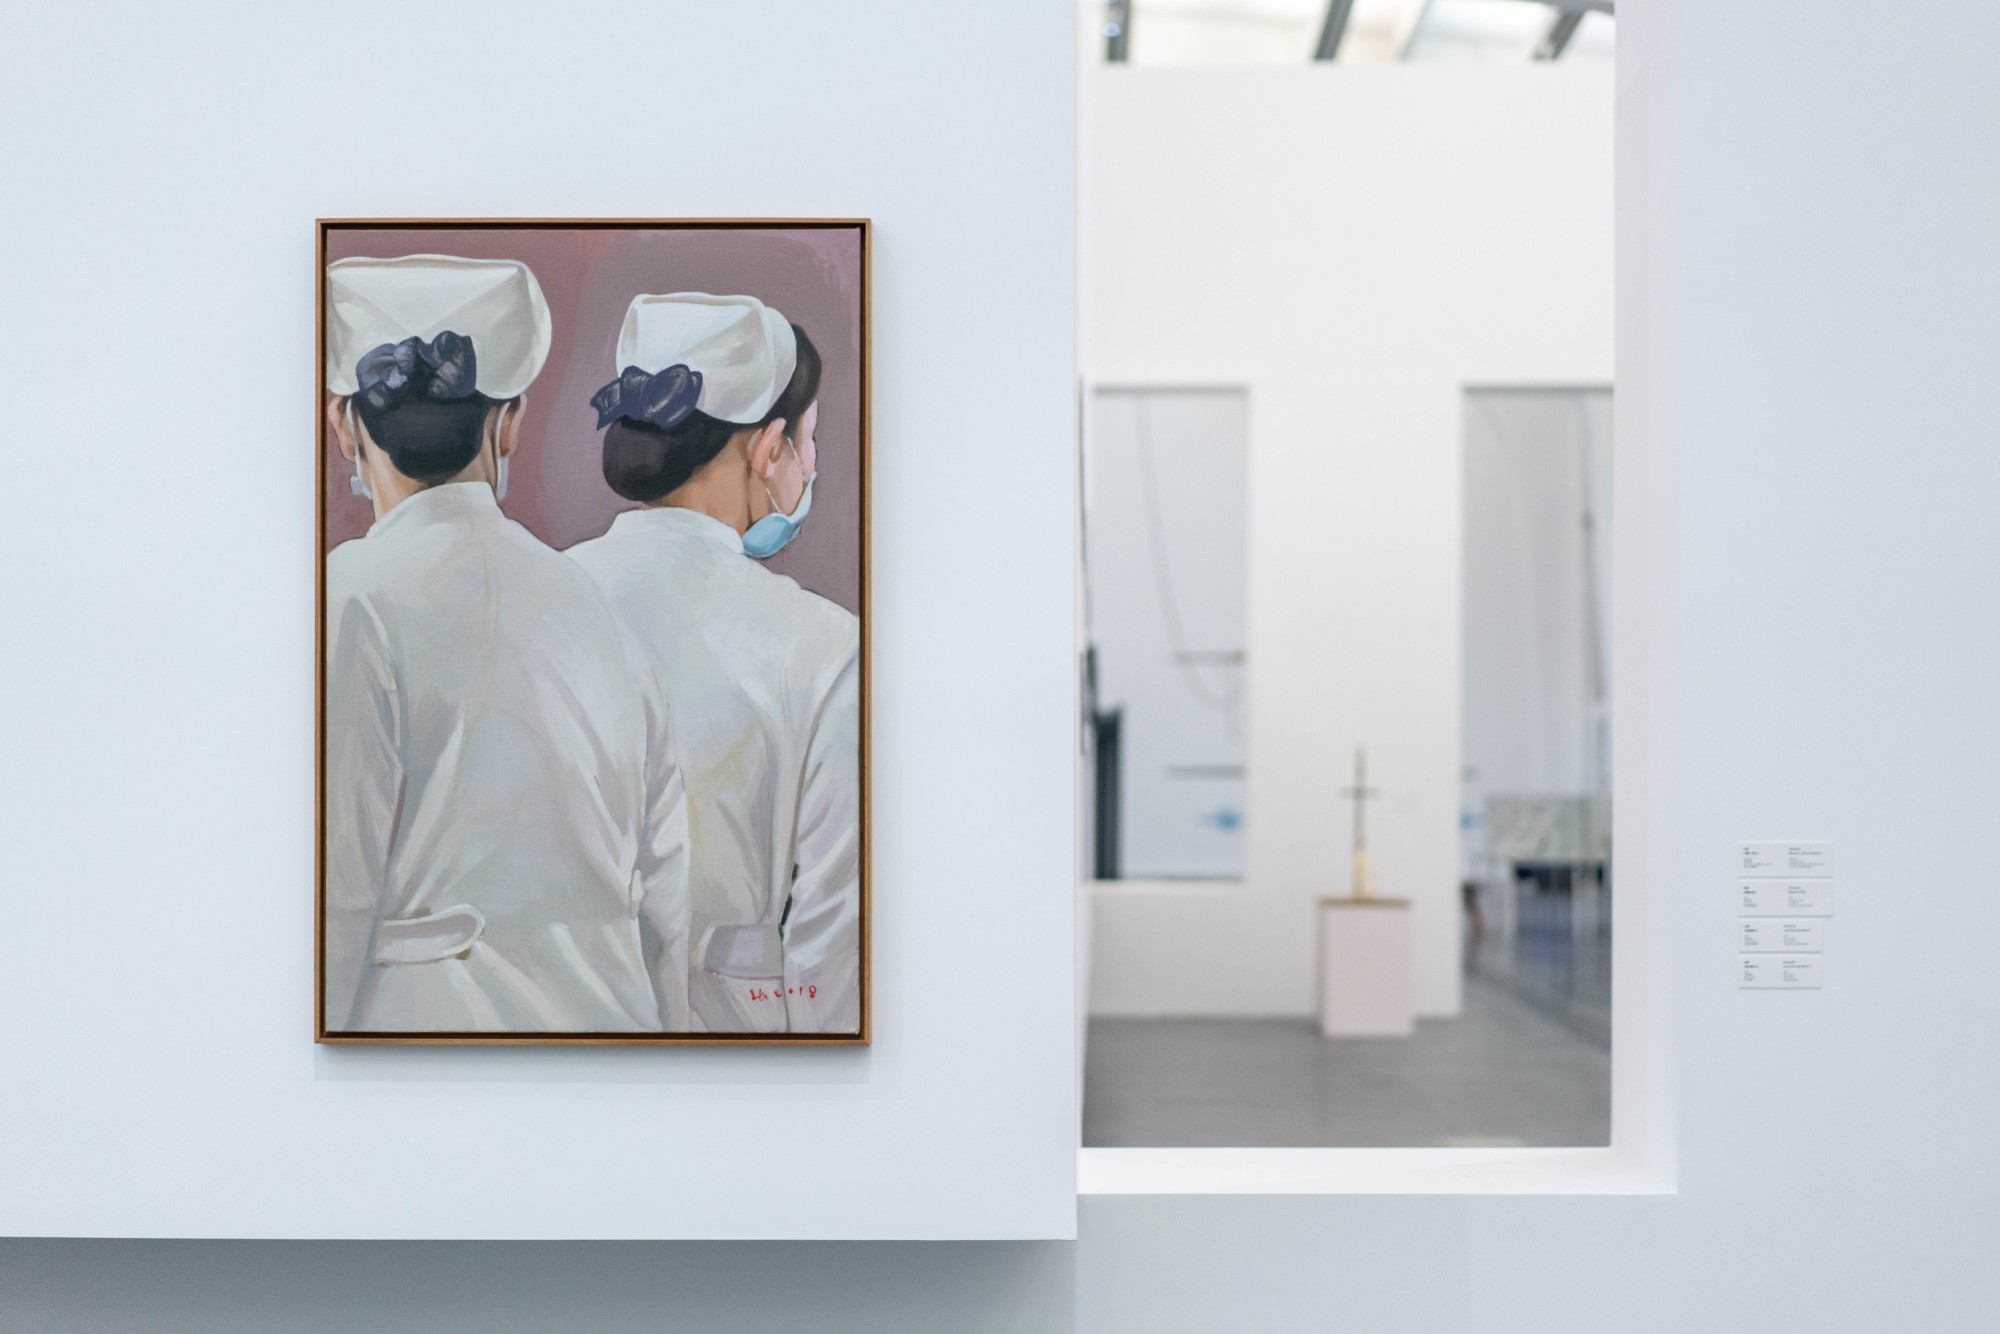
Figure 8 & 9. Photos of “Meditations in an Emergency” from https://ucca.org.cn/en/exhibition/meditations-in-an-emergency/
While many museums and galleries were keeping their old style, UCCA has already adjusted its direction to the outside changes, and it carried out efficiently. After COVID-19, visitors cared for their inner demands more than before because their comments contained a lot of “Think”, “Feeling”, and “Meaning” (figure 10, 11, 12), which was affected by the pandemic. UCCA’s first exhibition after COVID-19 is “Meditations in an Emergency”. The purpose of this exhibition is to comfort people, provide them with a chance to reflect, and recall their cohesion via art. The exhibition’s name comes from a poem written by Frank O’Hara. “In times of crisis, we must all decide again and again whom we love”. When the pandemic occurred, UCCA reacted immediately and showed their inclusion and responsibility for society and people powerfully. Except for that exhibition, UCCA also curated many exhibitions that are related to the times and people, such as “Immaterial / Re-material: A Brief History of Computing Art” and “Mirage: Contemporary Art in Augmented Reality” for exploring the relationship between humans and technologies. “Cao Fei: Staging the Era”, “Wang Tuo: Empty-handed into History”, and “Liu Xiaodong: Your Friends” was all about how humans reacted in different eras.
Magnify the stunt of each exhibition
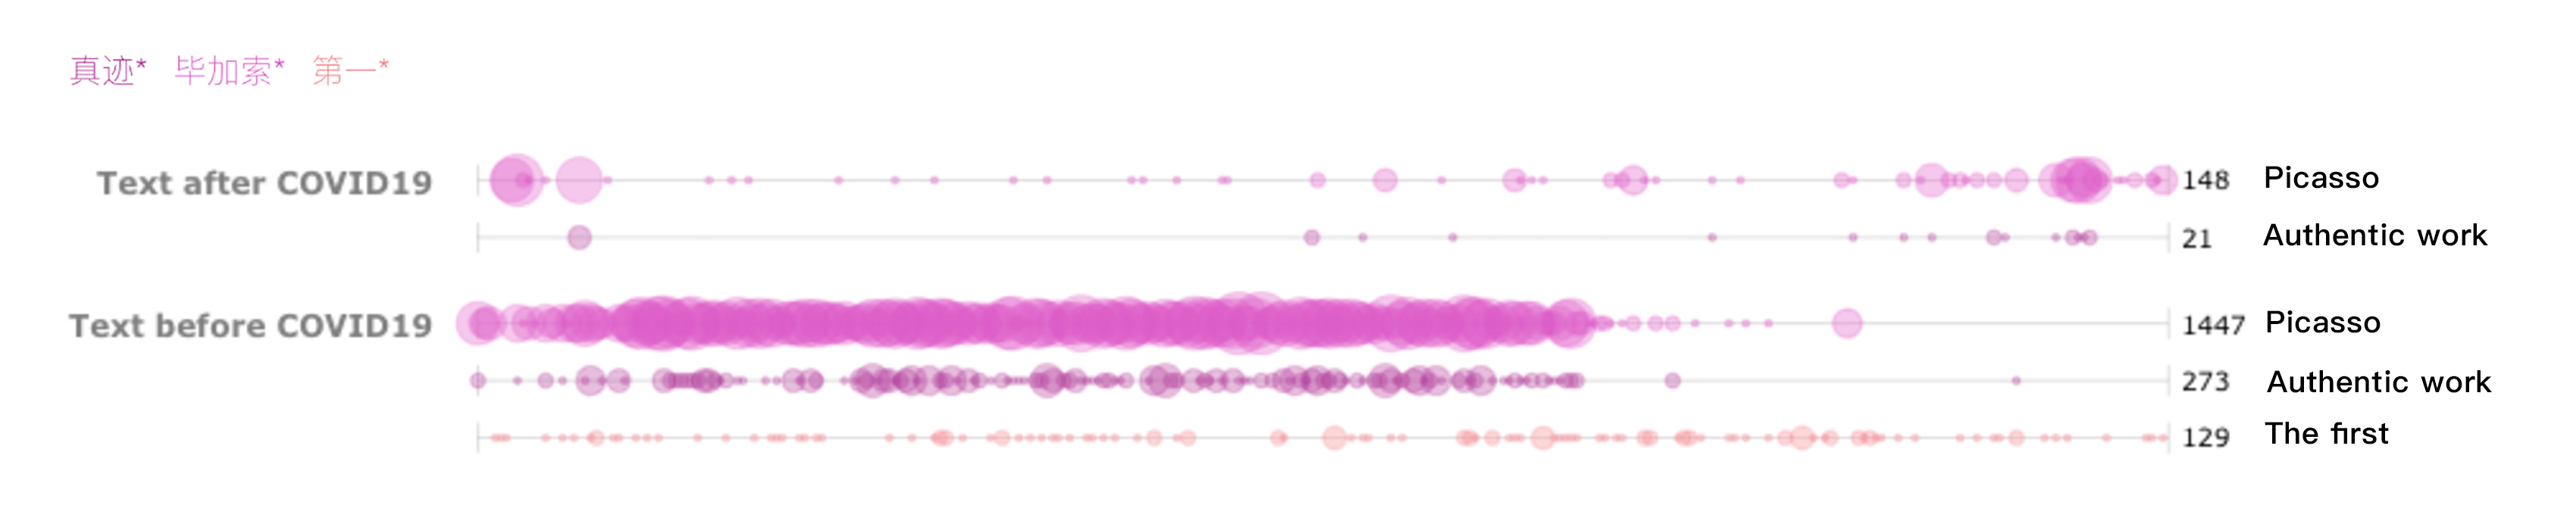
Figure 10. The frequency and distribution of terms: “Autograph”, “Picasso”, and “The first on”.
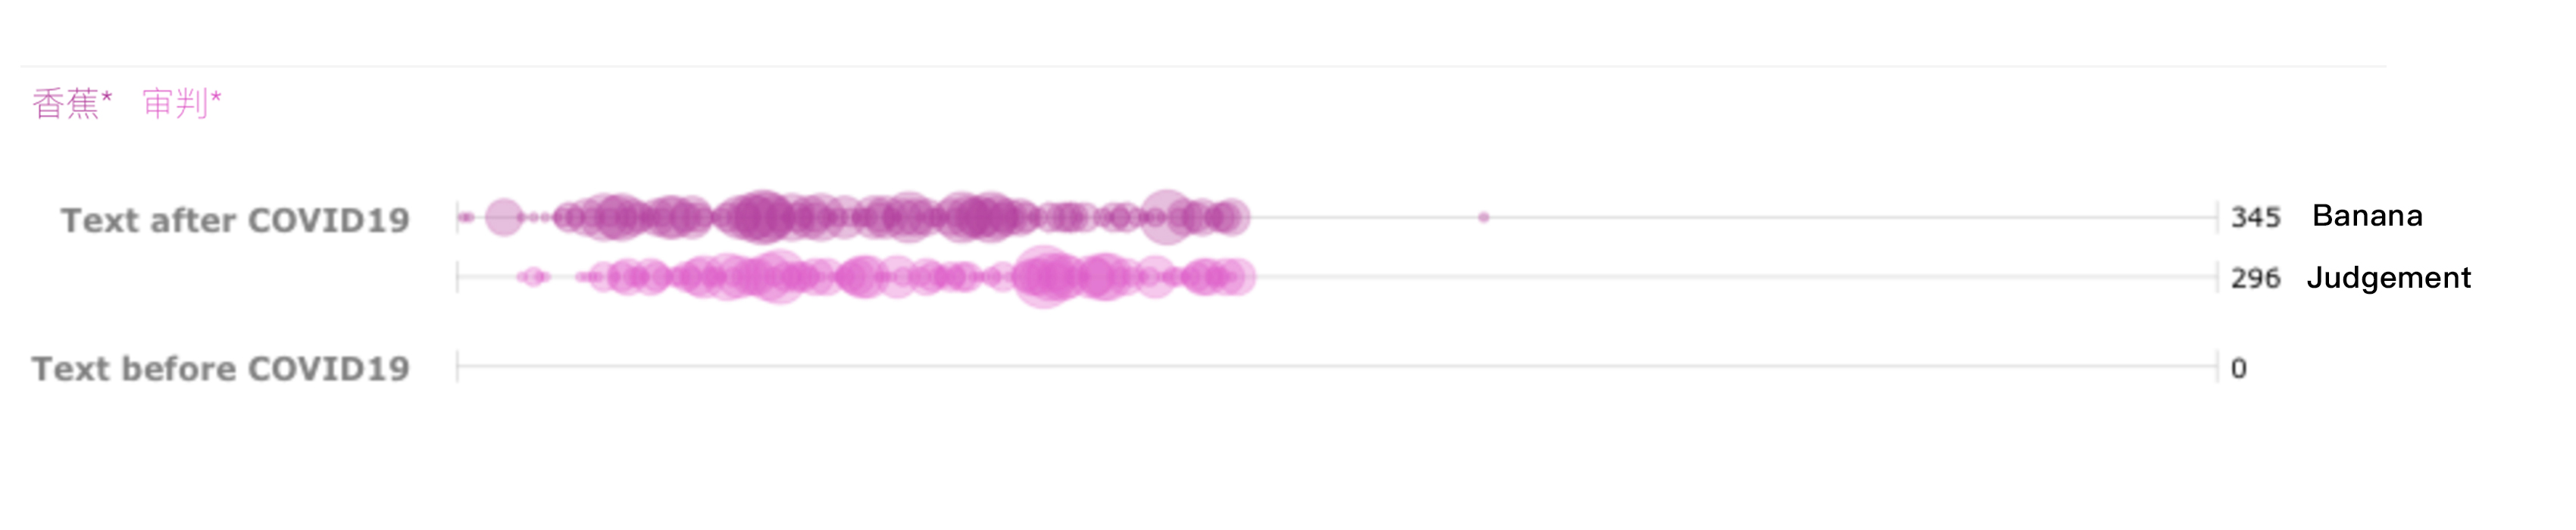
Figure 11. The frequency and distribution of terms: “Banana” and “Judgement”.
As for advertising strategies, in each exhibition, UCCA finds a stunt and magnifies it. Such as “the most famous artwork”, “the biggest exhibition yet”, “the first exhibition”, or “the most expensive artwork”, and other descriptions that sound rare. In figures 10 and 11, each selected word is represented as a bubble, and the size of the bubble indicates the word’s frequency in the document. The larger the bubble is, the more frequently the word occurs. During the exhibition “The last judgment”, the highest count term is “Banana”, which refers to an expensive artwork called “Comedian” created by Maurizio Cattelan, a real banana bound on the wall by a tape. And “Comedian” was sold for 12 million dollars in 2019. Thus, the distinctive term “Tape” was mentioned 34 times (Figure 5). The “Cake” refers to a banana cake designed by Holiland, one of the most popular cake brands in China. UCCA cooperated with it to sell banana cakes that were very similar to the “Banana” created by Cattelan, which was a good way to generate revenue. Another example is “Picasso: Birth of a genius”, the first Picasso exhibition in China. Visitors mentioned 294 times “真迹” (Authentic work), proving that they cared about the authenticity of the artwork, and were eager to become one of the first watchers of Picasso’s exhibition in China. Many people have been attracted by the stunts highlighted by UCCA on purpose.
Building close-knit relationship with customers
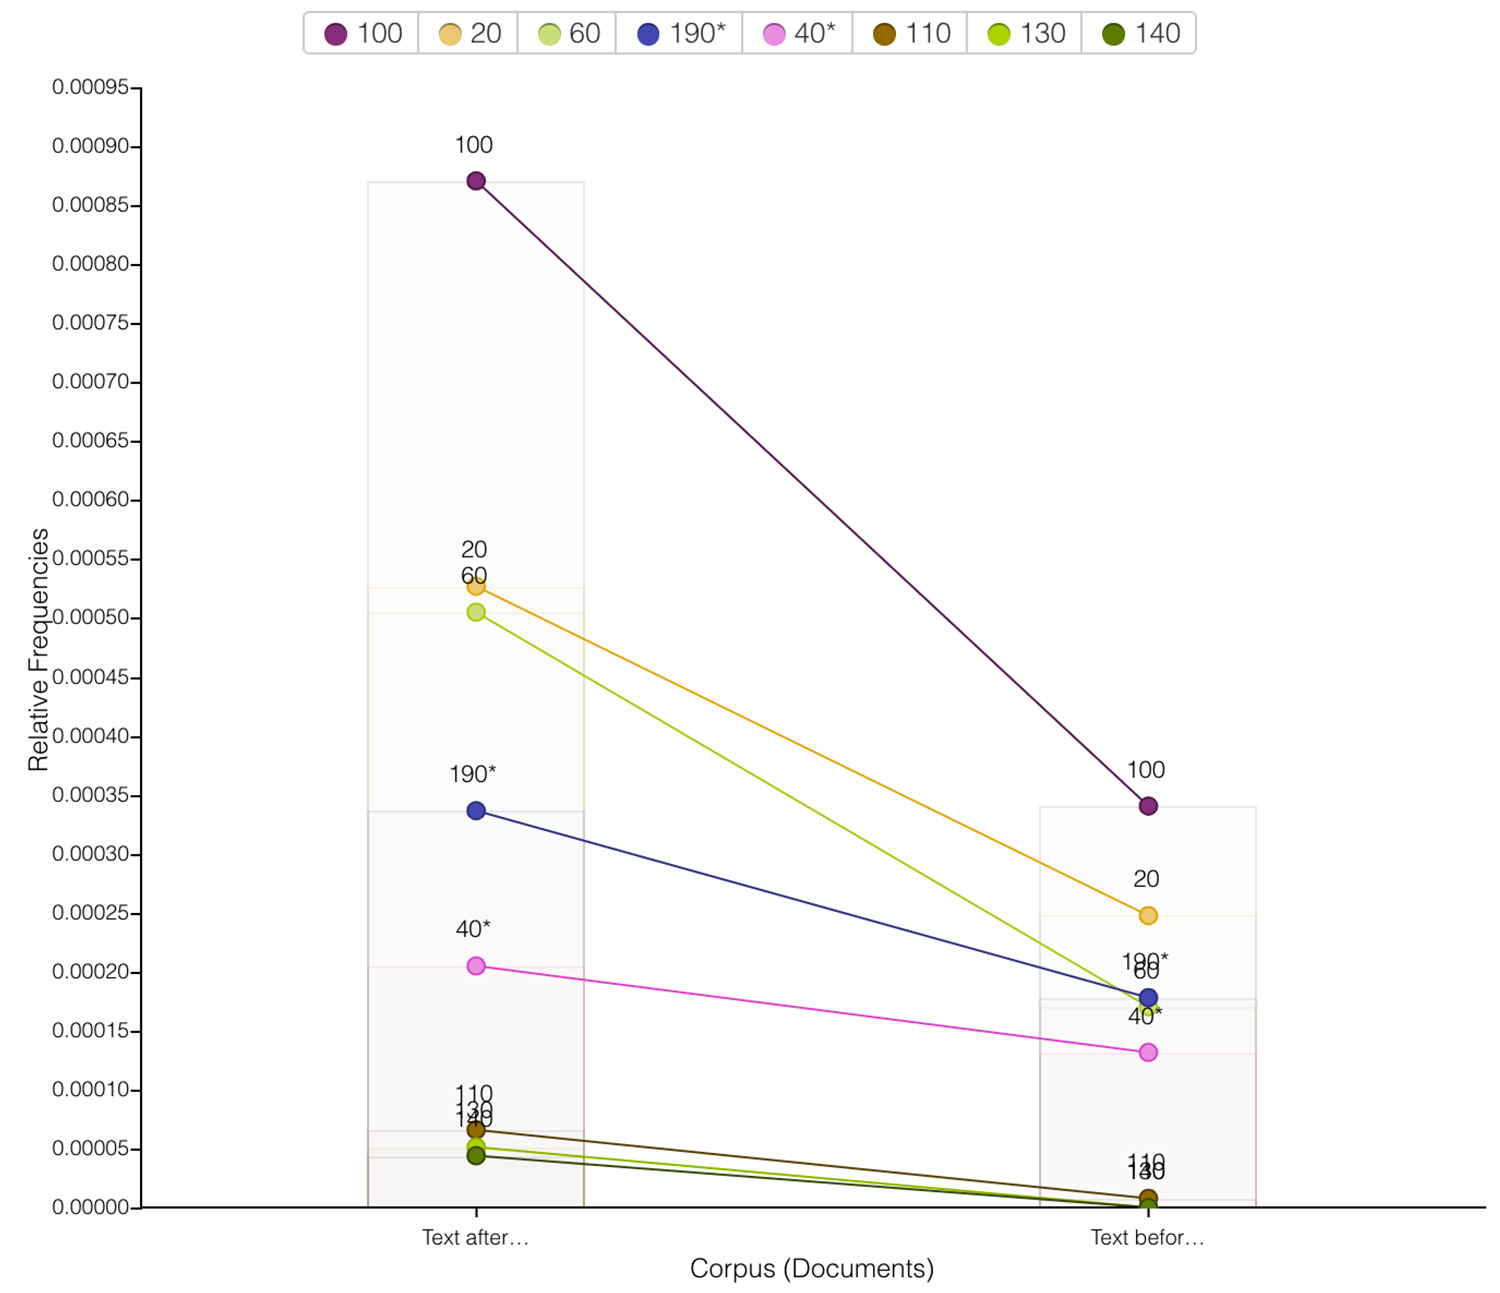
Figure 12. The distribution of increased numbers after COVID-19.
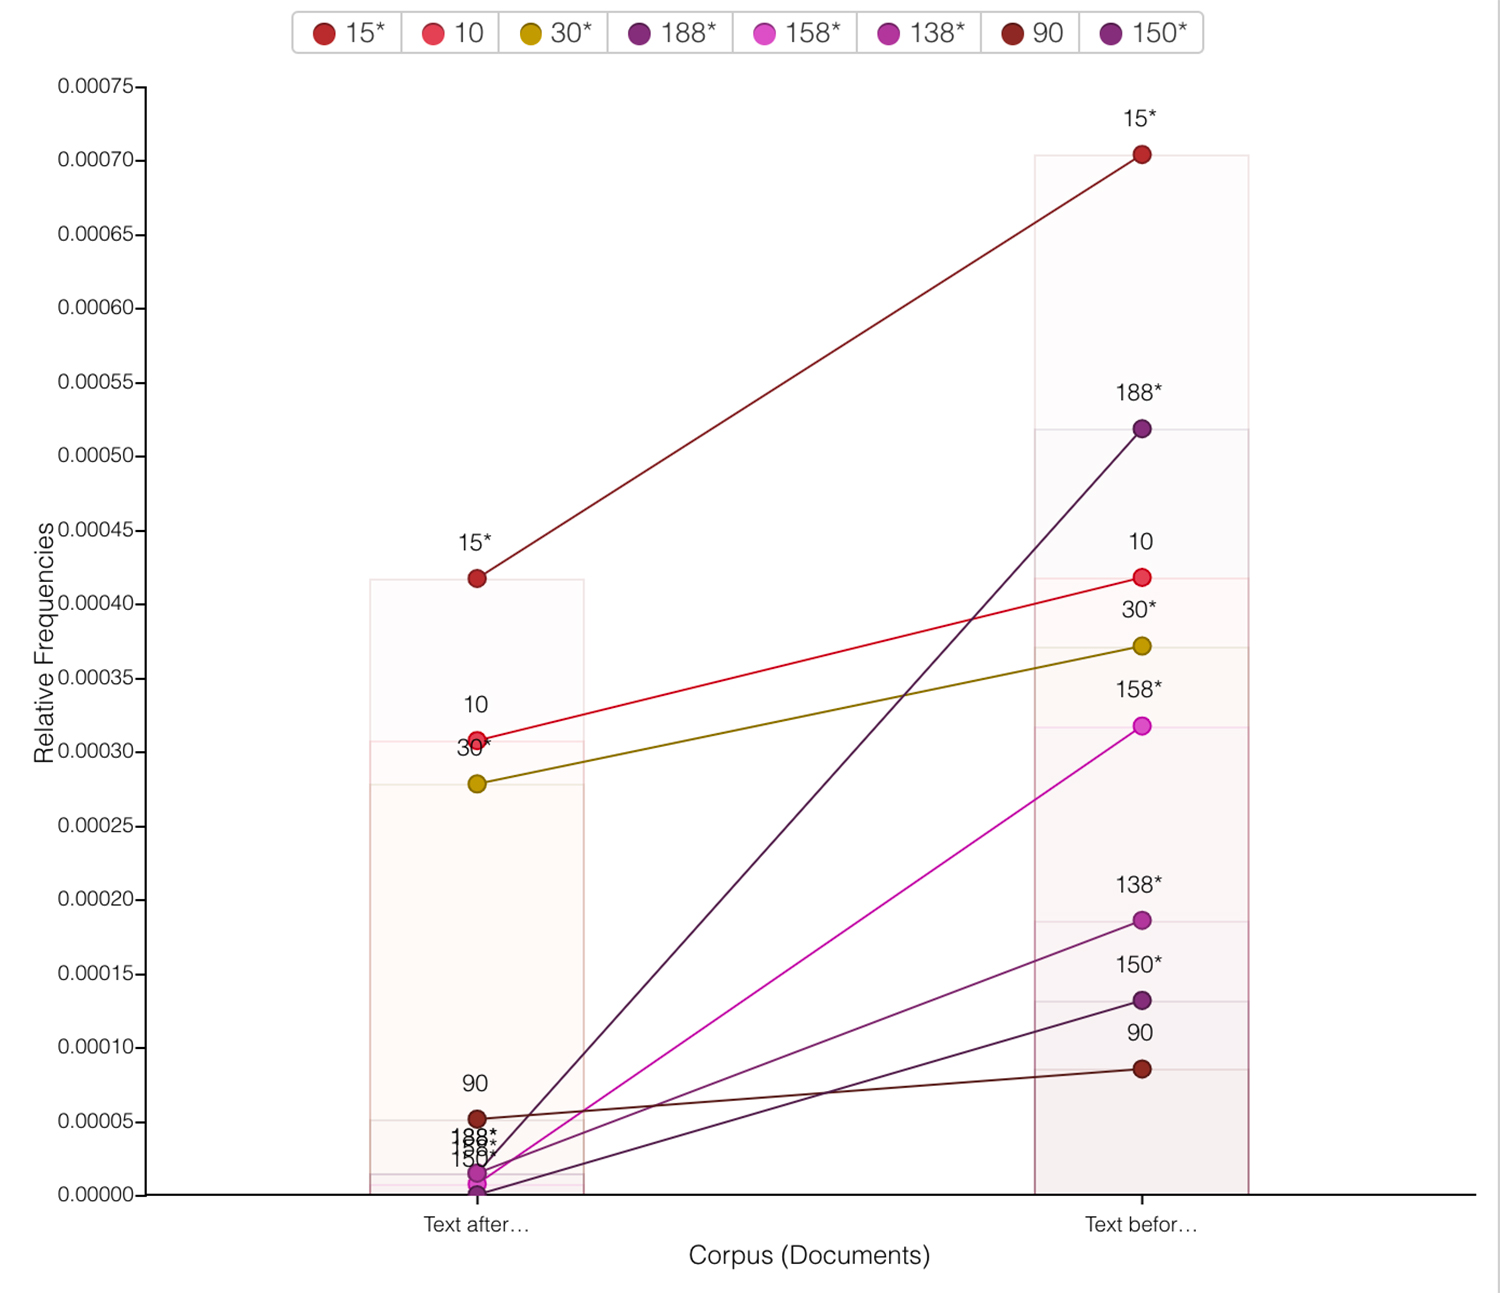
Figure 13. The distribution of decreased numbers after COVID-19.
Expensive tickets are hard to keep the audience. Thus, UCCA encouraged people to join in UCCA club by offering them another more “economical” plan, which is also a good way to nurture regular customers. In order to see the changes in prices, the author separated the decreased prices and the increased prices. The trends in Figure 11 show that UCCA narrowed down choices of ticket prices, and adjusted tickets at a price of 100 RMB mainly. A membership costs 500 RMB for an adult, and 800 RMB for a couple per year, including visiting all exhibitions except special programs. From comments, massive visitors introduced others to join in UCCA club because they thought UCCA membership was very cheaper than buying tickets separately. If a visitor could visit UCCA more than 5 times a year, joining membership is more economical. But at the same time, the original prices are still not cheap. UCCA just provided another seemly better choice for the audience.
The improved and unsolved problems of UCCA
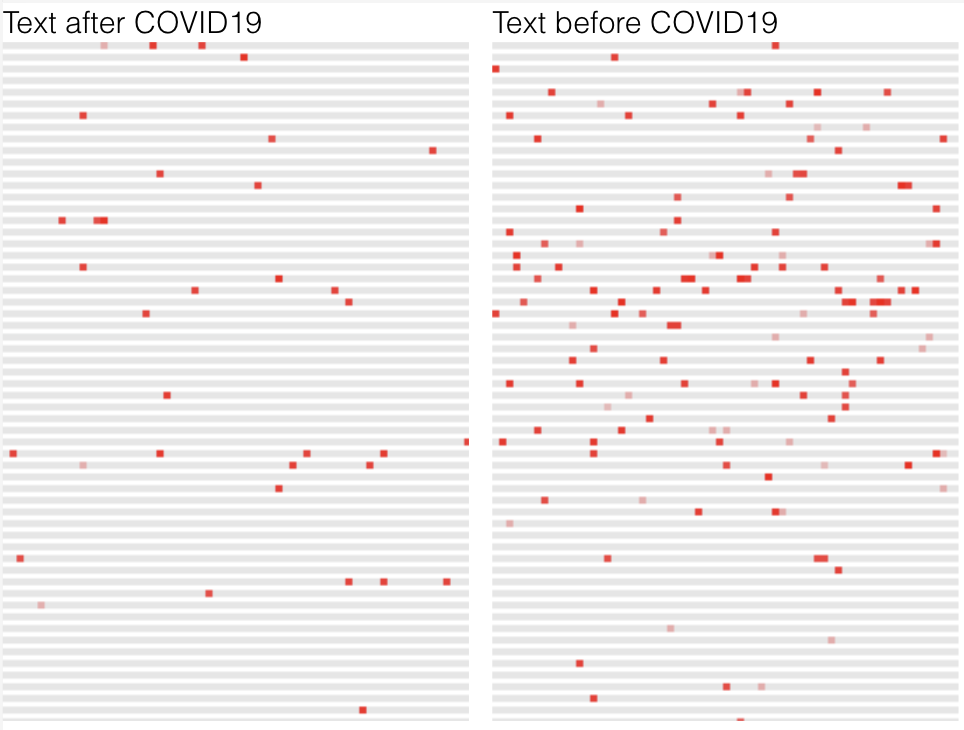
Figure 14. The frequency and distribution of terms: “Cold”, and “Air conditioner”.
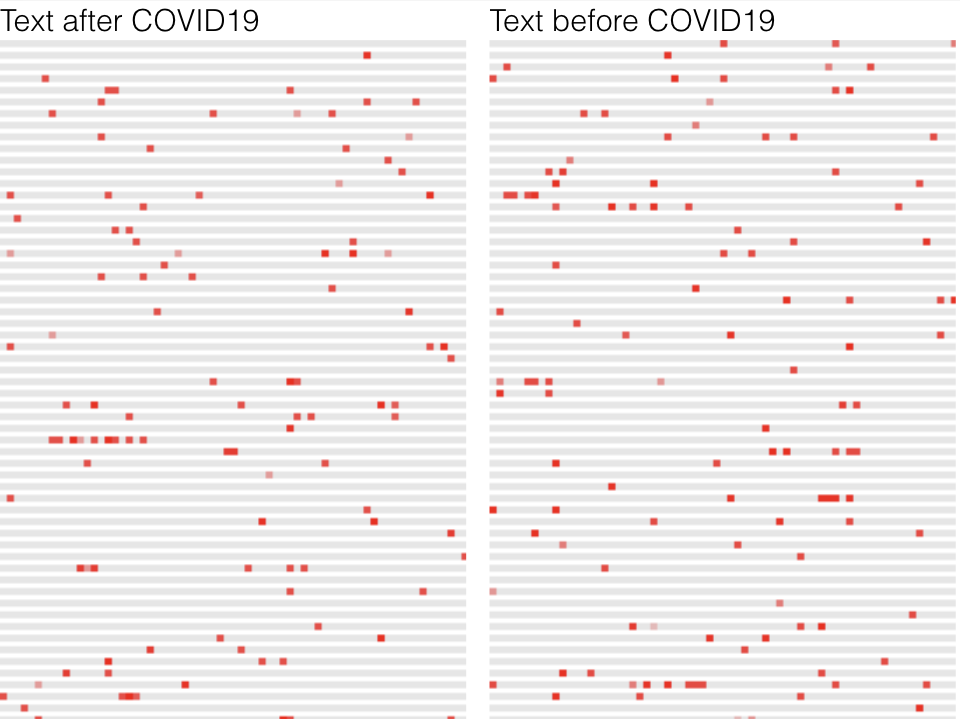
Figure 15. The frequency and distribution of terms: “Body guard”, “employees”, and “workers”.
In both periods, the impolite attitude of employees especially of bodyguards, and feeling too cold inside exhibition halls are mentioned many times. In figures 14 and 15, each document in the corpus is represented as a vertical block where the height of the block indicates the relative size of the document compared to others in the corpus. The location of occurrences of search terms is located as red blocks. In figure 14, the problem of cold has been improved after COVID-19 because the red points decreased a lot, namely fewer complaints about that issue. However, in terms of workers’ attitudes, red points spread regularly in both documents, which means that UCCA had not taken measures to solve this problem, or its solutions did not work too much. From the perspective of the audience, UCCA’s employees need to improve their work profession and attitude. This problem may be caused by the reason that many workers are volunteers or interns, thus, their performance cannot be guaranteed.
CONCLUSION AND FUTURE WORK
This research used web text analysis to understand visitors’ experience in UCCA based on comments from Dianping.com, and analyzed UCCA’s strategies and problems. As a result of the analysis, it shows that when the outside environment and demands of the audience change, it is also necessary for art institutions to switch their strategies, especially in the post-pandemic era. This article demonstrates a new way for art managers to understand museum visitors. The method can be replicated by researchers to analyze their own institutions. Meanwhile, researchers should conduct longitudinal studies to observe changes in visitor experiences because the visitors are changing in ages, mindsets, and preferences over time (Black, 2015).
There are some limitations to this study. Firstly, the data collected is limited by this single data resource of Dianping.com. If time allows, the corresponding research should widely use a variety of social media data, such as Sina Weibo, WeChat, etc. To be more comprehensive to understand the visitors. In addition, this study only focused on web text but excluded some certain categories of visitors, such as kids, the elderly, and people who do not own a smartphone or do not use Dianping.com. Thus, future research could combine online reviews and questionnaires, and quantitative and qualitative analysis to build a more solid foundation for results (Hetenyi et al., 2019). Lastly, Dianping.com is a commercial platform, inevitably, some comments are not objective since it was biased by commercial profits or personal preference, which can influence the results. And the quantity of data can also affect the analysis. Thus, more data resources and more data are needed in the future for obtaining more precise and scientific results.
FOOTNOTES
① Close reading is a thoughtful, critical analysis of a text that focuses on significant details or patterns in order to develop a deep, precise understanding of the text’s form, craft, meanings, etc. https://nieonline.com/tbtimes/downloads/CCSS_reading.pdf
② A new museum definition approved by ICOM on August 24, 2022. The full text is: A museum is a not-for-profit, permanent institution in the service of society that researches, collects, conserves, interprets and exhibits tangible and intangible heritage. Open to the public, accessible and inclusive, museums foster diversity and sustainability. They operate and communicate ethically, professionally and with the participation of communities, offering varied experiences for education, enjoyment, reflection and knowledge sharing.
https://icom.museum/en/news/icom-approves-a-new-museum-definition/
③ "Exhibition 1” is “The last judgement”, "Exhibition 2” is “Birth of a genius”, "Exhibition 3” is “Meditations in an emergency: Intermediate Status”, and "Exhibition 4” is “Staging the era”. “Artist 1” is Maurizio Cattelan, “Artist 2” is Andy Warhol, and “Artist 3” is Cao Fei.
REFERENCE
Bitgood, S. (2013). Attention and value: Keys to understanding museum visitors. New York:
Routledge. https://doi.org/10.4324/9781315433455
Chandra, J. K., Cambria, E., & Nanetti, A. (2020, November). One belt, one road, one sentiment? A hybrid approach to gauging public opinions on the New Silk Road initiative. In 2020 International Conference on Data Mining Workshops (ICDMW) (pp. 7-14). IEEE. https://doi.org/10.1109/ICDMW51313.2020.00011
Chang, M., Yi, T., Hong, S., Lai, P. Y., Jun, J. Y., & Lee, J.-H. (2022, September). Identifying museum visitors via social network analysis of Instagram. Journal on Computing and Cultural Heritage, 15(3). https://doi.org/10.1145/3505635
CHENG Wei,SUI Li-na, & CHENG Mo. (2014). Study on the perception of tourism image on Silk Road based on web text analysis. West Forum, 24 (5), 101-108. DOI:10.3969 /j.issn.1674-8131.2014.05.12. [程圩, 隋丽娜, & 程默. (2014). 基于网络文本的丝绸之路旅游形象感知研究.西部论坛, 24(5), 101-108.]
Dirsehan, Taşkın & Yalçın, Azize. (2011). Comparison between Holistic Museum visitors and Utilitarian Museum visitors. International Journal of Marketing Studies, 3(4), 78-94. http://dx.doi.org/10.5539/ijms.v3n4p78
Emily Dawson & Eric Jensen. (2011). Towards a contextual turn in visitor studies: Evaluating visitor segmentation and identity-related motivations, Visitor Studies, 14(2), 127-140. http://dx.doi.org/10.1080/10645578.2011.608001
Everett, M., & Barrett, M. S. (2009). Investigating sustained visitor/museum relationships: Employing narrative research in the field of museum visitor studies. Visitor Studies, 12(1), 2–15. https://doi.org/10.1080/10645570902769084
Feng, Yung-Chih & Lin, Weijane. (2021). Exploring art museum experiences with exhibit label design: A visitor study approach. Journal of Library and Information Studies, 19(2), 145-172. DOI: http://dx.doi.org/10.6182/jlis.202112_19(2).145
Falk, J. H., & Dierking, L. D. (1992). The museum experience. Washington D.C:
Whalesback Books.
Falk, J. (2016). Museum audiences: A visitor-centered perspective. Loisir et Société / Society and Leisure, 39(3), 357–370. https://doi.org/10.1080/07053436.2016.1243830
Gu, Jing & He, Qijun. (2021). Museum education and communication effectiveness on social media platforms: A study on Shanghai Museum WeChat’s official account. Communication Management. 2. 65-77.
Hein, G. E. (1998). Learning in the museum. New York: Routledge.
Hotho, Andreas & Nürnberger, Andreas & Paass, Gerhard. (2005). A brief survey of text mining. LDV Forum - GLDV Journal for Computational Linguistics and Language Technology, 20, 19-62.
Hodhod, R., & Fleenor, H. (2018). A text mining based literature analysis for learning theories and computer science education. In A. E. Hassanien, K. Shaalan, T. Gaber, & M. F. Tolba (Eds.), Proceedings of the International Conference on Advanced Intelligent Systems and Informatics 2017 (Vol. 639, pp. 560–568). New York: Springer International Publishing. https://doi.org/10.1007/978-3-319-64861-3_52
Hetenyi, G., Dr. Lengyel, A., & Dr. Szilasi, M. (2019). Quantitative analysis of qualitative data: Using Voyant tools to investigate the sales-marketing interface. Journal of Industrial Engineering and Management, 12(3), 393. https://doi.org/10.3926/jiem.2929
He, Dan., Li, Xueyan., Zhou, Aihua & Fu, Xiao. (2017). Museum tourism experience in Beijing: Based on internet text content analysis of Dianping.com. Resource Development & Market. 33 (2). http://en.cnki.com.cn/Article_en/CJFDTotal-ZTKB201702023.htm
Brida, J.G., Meleddu, M. and Pulina, M. (2016). Understanding museum visitors’ experience: A comparative study, Journal of Cultural Heritage Management and Sustainable Development, 6(1), 47-71. http://dx.doi.org/10.1108/JCHMSD-07-2015-0025
Jiawei Han, Micheline Kamber, Jian Pei. (2012). Mining frequent patterns, associations, and correlations: Basic concepts and methods. In The Morgan Kaufmann Series in Data Management Systems, Data Mining (Third Edition). Massachusetts: Morgan Kaufmann, 243-278. https://doi.org/10.1016/B978-0-12-381479-1.00006-X.
Jiang, Dengyu & Fu, Yunxin. (2020). Research on tourism development of Opium War Museum based on network text analysis. Scholars Journal of Economics, Business and Management. 7. 79-83. http://dx.doi.org/10.36347/sjebm.2020.v07i02.004
John H. Falk & Katie L. Gillespie. (2009). Investigating the role of emotion in science center visitor learning, Visitor Studies, 12(2), 112-132. http://dx.doi.org/10.1080/10645570903203414
Jordi López Sintas, Ercilia García Álvarez & Elena Pérez Rubiales. (2014). Art museum visitors: Interaction strategies for sharing experiences, Museum Management and Curatorship, 29(3), 241-259. http://dx.doi.org/10.1080/09647775.2014.919175
Krippendorff, K. (2018). Content analysis: An introduction to its methodology. Beverly Hills: Sage publications.
Kydros, Dimitrios & Vrana, Vasiliki. (2021). A Twitter network analysis of European museums. Museum Management and Curatorship, 36(4), 1-21. http://dx.doi.org/10.1080/09647775.2021.1894475
Lee, J.-H. (Ed.). (2021). A new perspective of cultural DNA. Springer Singapore. https://doi.org/10.1007/978-981-15-7707-9
Miller, A. (2018). Text mining digital humanities projects: Assessing content analysis capabilities of Voyant tools. Journal of Web Librarianship, 12(3), 169–197. https://doi.org/10.1080/19322909.2018.1479673
Maramba, I. D., Davey, A., Elliott, M. N., Roberts, M., Roland, M., Brown, F., Burt, J., Boiko, O., & Campbell, J. (2015). Web-based textual analysis of free-text patient experience comments from a survey in primary care. JMIR Medical Informatics, 3(2), 20. https://doi.org/10.2196/medinform.3783
Sheng, C.-W., & Chen, M.-C. (2012). A study of experience expectations of museum visitors. Tourism Management, 33(1), 53–60. https://doi.org/10.1016/j.tourman.2011.01.023
Sinclair, S. & G. Rockwell. (2022). Voyant Tools. Retrieved September 2, 2022. https://voyant-tools.org/?corpus=852b0827e9b948050d4ae6604a4517c6
Sinclair, S. & G. Rockwell. (2022). Terms. Voyant Tools. Retrieved September 2, 2022, from https://voyant-tools.org/?stopList=stop.cn.chinese-lawrence.txt&corpus=88f66cf8b353dd380a76fa500c3fec69&view=CorpusTerms
Sinclair, S. & G. Rockwell. (2022). MicroSearch. Voyant Tools. Retrieved September 2, 2022, from https://voyant-tools.org/?palette=d3_cat20b&stopList=stop.cn.chinese-lawrence.txt&query=%E7%A9%BA%E8%B0%83*&query=%E5%86%B7*&query=%E5%86%B7%E6%B0%94&query=%E5%86%B7&corpus=88f66cf8b353dd380a76fa500c3fec69&view=MicroSearch
Sinclair, S. & G. Rockwell. (2022). MicroSearch. Voyant Tools. Retrieved September 2, 2022, from https://voyant-tools.org/?palette=d3_cat20b&stopList=stop.cn.chinese-lawrence.txt&query=%E6%80%81%E5%BA%A6*&query=%E4%BA%BA%E5%91%98*&query=%E5%91%98%E5%B7%A5*&query=%E4%BF%9D%E5%AE%89*&corpus=88f66cf8b353dd380a76fa500c3fec69&view=MicroSearch
Sinclair, S. & G. Rockwell. (2022). Summary. Voyant Tools. Retrieved September 2, 2022, from https://voyant-tools.org/?palette=d3_cat20b&stopList=stop.cn.chinese-lawrence.txt&limit=59&corpus=88f66cf8b353dd380a76fa500c3fec69&view=Summary
Sinclair, S. & G. Rockwell. (2022). Trends. Voyant Tools. Retrieved September 2, 2022, from https://voyant-tools.org/?palette=d3_cat20b&stopList=stop.cn.chinese-lawrence.txt&query=10&query=20&query=90*&query=90&query=40&query=30*&query=30&query=110*&query=110&query=130*&query=130&query=140*&query=140&query=190*&query=158*&query=138*&query=188*&query=60&query=15*&query=100*&query=150*&corpus=88f66cf8b353dd380a76fa500c3fec69&view=Trends
Sinclair, S. & G. Rockwell. (2022). Trends. Voyant Tools. Retrieved September 2, 2022, from https://voyant-tools.org/?palette=d3_cat20b&stopList=stop.cn.chinese-lawrence.txt&query=10&query=150*&query=90&query=138*&query=158*&query=188*&query=30*&query=15*&labels=true&corpus=88f66cf8b353dd380a76fa500c3fec69&view=Trends
Sinclair, S. & G. Rockwell. (2022). Trends. Voyant Tools. Retrieved September 2, 2022, from https://voyant-tools.org/?palette=d3_cat20b&stopList=stop.cn.chinese-lawrence.txt&query=40*&query=190*&query=140&query=130&query=110&query=100&query=60&query=20&labels=true&corpus=88f66cf8b353dd380a76fa500c3fec69&view=Trends
Sinclair, S. & G. Rockwell. (2022). Bubblelines. Voyant Tools. Retrieved September 2, 2022, from https://voyant-tools.org/?palette=d3_cat20b&stopList=stop.cn.chinese-lawrence.txt&bins=300&query=%E7%AC%AC%E4%B8%80*&query=%E6%AF%95%E5%8A%A0%E7%B4%A2*&query=%E7%9C%9F%E8%BF%B9*&docId=10d4b1433e13bf0c4c0542a09cf801f9&docId=d8fc4479b732da08e9de8f18512acf41&corpus=88f66cf8b353dd380a76fa500c3fec69&view=Bubblelines
Sinclair, S. & G. Rockwell. (2022). Bubblelines. Voyant Tools. Retrieved September 2, 2022, from https://voyant-tools.org/?palette=d3_cat20b&stopList=stop.cn.chinese-lawrence.txt&bins=300&query=%E5%AE%A1%E5%88%A4*&query=%E9%A6%99%E8%
Sinclair, S. & G. Rockwell. (2022). Contexts. Voyant Tools. Retrieved September 3, 2022, from https://voyant-tools.org/?query=%E7%A5%A8*&query=%E7%A5%A8&query=%E7%A5%A8%E4%BB%B7&query=%E5%85%83*&query=%E5%85%83&corpus=88f66cf8b353dd380a76fa500c3fec69&view=Contexts
The Art Newspaper. (2020). Art’s most popular: Exhibition and museum visitor figures 2019
(SPECIAL REPORT No. 322). London: The Art Newspaper https://www.museus.gov.br/wp-content/uploads/2020/05/Arts-Most-Popular-visitor-figures-2019.pdf
Welsh, Megan E. (2014). Review of Voyant Tools. Collaborative Librarianship, 6(2), 96-97. https://digitalcommons.du.edu/collaborativelibrarianship/vol6/iss2/8
YiT, LeeH-y, YumJ, LeeJ-H. (2022). The influence of visitor-based social contextual
information on visitors’ museum experience. PLOS ONE, 17(5): e0266856.